• Indian skies has seen several name changes over last 20 years. Two names have stayed the same throughout – Indigo and Air India. The execution and management’s conservative attitude is the reason that InterGlobe has continued to remain one of the most profitable airlines with a market share of 65% as of February 2025. Industry’s own fatal mistakes are also the reason the airline has seen its execution payoff. In this blog, we will look at Indigo’s strategy, financials, competition and future outlook from the perspective of an investor to understand the business.

    Source: Herve Gousse MasterFilms

    P.S. – This article is purely meant for educational purposes. Do not consider any conclusions from this blog as buy or sell decisions. Please do your own independent research for investment purposes. This blog is not responsible for any loss in investment by the reader. As a disclaimer, the writer of this blog holds an investment in the given stock.

    Industry outlook

    Indian aviation sector experienced a full recovery in FY24. It is the third largest aviation market in the world. The sector surpassed pre covid-19 levels by carrying 10.3% more passengers in FY24. Total domestic passengers carried in CY2024 stood at 161 million as compared to 152 million in CY2023. India’s international travel demand stood at 69.7 million passengers in FY24 vs 69.5 million in FY19. Covid induced travel restrictions severely impacted the international markets. India has doubled its operational airport count from 74 in 2014 to 157 in 2024. India’s seat per capita continues to remain significantly under penetrated with 0.13 seats per capita vs Untied States’ 3.09 and China’s 0.5. Indian aviation industry will continue to grow slightly faster than GDP growth. Aviation industry is a cyclical industry by nature but also can be seen as a consumer discretionary industry due to the nature of flying either for business or leisure. GDP growth has a strong influence on airlines’ revenue growth as both are strongly correlated.

    Source: IATA

    Indigo’s stock returns vs Nifty

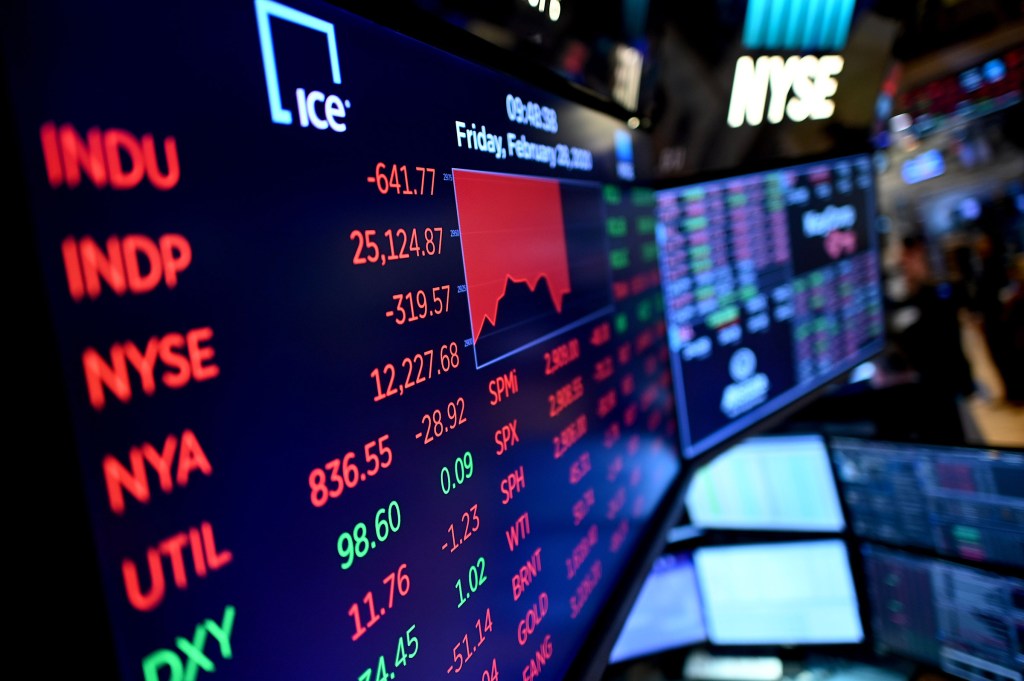
    Indigo listed on November 10, 2015 at a price of 856 rupees per share. Shares were offered at a price of 765 rupees per share. Nifty settled at 7,780 points on November 10, 2015. Since then Indigo has gained 5.58 times to 4,780 rupees per share on March 17, 2025. Nifty in the same time has gone 2.89 times. Interglobe Aviation has comfortably outperformed Nifty 50. Aviation industry is notorious for bankruptcies but this stock has minted money for its investors despite the volatile nature of the industry. Indigo has continually gained market share and is now well placed to capture demand over next few years.

    Indigo and the low cost model disruption

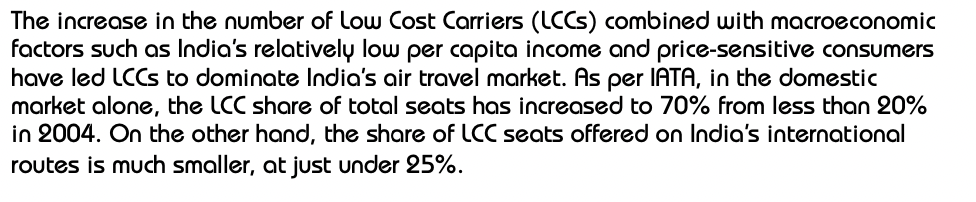
    InterGlobe Aviation was founded in 2005 by Rahul Bhatia and Rakesh Gangwal and started its operations in 2006. During the same period, we had other airlines like SpiceJet also enter the market. Indigo is predominantly focused low cost model of airline operations which made its product offering different from what Jet Airways, Air India and Kingfisher offered at the time. Its model has always focused on low price, hassle free service and on time performance. What made it different is the fact that being a low cost carrier model the airline is only focused on getting passengers from one point to another without much service, fast turnaround times and standardised fleet. Anything over and above flying, like food or in flight entertainment are out of question unless paid for. This marked the start of first disruption in Indian aviation market as before that competition in that respect was never truly seen. Jet, Air India and Kingfisher were predominantly focused on offering full services. InterGlobe’s first order for aircraft was placed in 2005 with an order book of 100 A320 family single aisle aircraft. Since the start, the company focused on scale and with good reason which we will see later. Low cost carriers now dominate the Indian skies with Akasa now offering ultra low cost service on its route. When Indigo launched low cost carriers had a market share of close to 6-7% based on Jet’s IPO prospectus. As of February 2025, low cost carriers constitute more than 70% of market share of airline industry in India with Indigo predominantly holding the majority.

    Source: Indigo Annual Reports

    Masterful execution?

    First let’s understand what things are relevant to an airline business. Fleet size and composition, age of the fleet, order book, network, domestic vs international mix, financing, an active secondary market for aircraft leasing and trading and competition. Big fleet size and standardisation is extremely critical from a low cost carrier’s perspective. Same aircraft across entire fleet can pay dividends as all pilots have to be certified in same aircraft type, discounting with OEMs becomes easier as order sizes are big enough to dominate delivery timelines for years and it becomes easier for operations in case of disruption due to aircraft issues as they can be swapped easily. Network planning also plays a critical role as aircraft utilisation has to remain high and network density can create multiplier effects as airline can offer hassle free connections and also able to fill flights which could otherwise go empty. A well connected network means customer doesn’t have to book any other connecting flight separately. Lower the age of the fleet the better as the airline doesn’t have to face downtime and face huge maintenance costs which is associated with older aircrafts. It also adds to the cost as the time aircraft spends at ground leads to lost revenue and poor customer service in case of older aircraft where interior may feel outdated which requires another big round of capex to modify and replace the interior. Domestically yields are lower for airlines vs international so international network offers a chance to improve margins and compete better if complemented with a strong domestic network. An active market for aircraft buying, selling and leasing becomes central to airline’s fleet strategy and different aircrafts can offer different type of liquidity which directly impacts ability to grow, utilise aircraft well and sale of older aircraft.

    Keeping above things in mind, Indigo has created a perfect recipe to corner the market in present and future. Indigo’s first bold move to order 100 A320 aircraft indirectly has become central to success given management’s ability to absorb these aircraft efficiently in the fleet. To put things into context, in 2005 Jet Airways had just listed and had a fleet of 42 aircraft while SpiceJet had just commenced operations and had a total order book of 20 aircraft with Boeing. Air Deccan had only 11 aircraft and Air India group had highest with 62 aircraft in fleet. Total aircraft in operation at the time based on Jet’s IPO prospectus puts it at 135. Ordering 100 aircraft in one go by anyone’s thinking would be nuts. It required vision on the part of the promoters. Ordering almost entire capacity of India in one go is unthinkable. Of course delivery was going to happen over next decade but absorbing entire capacity into market profitability would bother any management. Ordering 100 aircraft also got Indigo big negotiating power with Airbus which at the time was desperately trying to battle Boeing to gain market share in India. Indigo received hefty discounts going by few reports in media. A A320 priced at $35 million dollars for most loyal customers was sold to Indigo at $25 million. Since the start, Indigo looked to built a dense domestic network with low fares, standard fleet and decent and basic levels of customer service. India’s geography has also played a role in its success as most flights in India have short duration where customer is more focused on basic service rather than full service or expect a luxury experience on ground with first class lounge for a 1 to 3 hours flight. This made more sense for international medium to long haul flights where services required might increase considerably and lower fare might bring a bigger trade off with comfort and services. Indian market was fundamentally different from American and European markets thus following playbook of Western airlines could be inherently disadvantageous. Indigo got big negotiating power with Airbus, ability to price fares lower than competition and also control of its fortune. Going with the A320, it offered Indigo an active market to clear out older aircraft as well which is essential to keeping costs under control. Indigo usually keeps aircrafts on average for 6 years in its fleet before returning them to lessors. Average age of fleet is somewhere around 3-4 years right now for the airline. Indigo doesn’t own the aircraft as it takes delivery at lower cost and sells the aircraft to lessors. Thus Indigo got a big head start in cost, competitive intensity and network in the domestic market.

    Source: Indigo Annual Reports

    Stroke of luck and poor competition

    A big stroke of luck Indigo has found is with poor balance sheets of competitors, lack of proper maintenance of aircraft on competitors’ fleets, management failures and failure of Boeing. Airline industry in India has been to painful to all airlines in India. Extremely high cost of operations, highly price sensitive customers, lack of competent staff, ill mannered customers leading to staff stress and negative publicity and slow pace of infrastructure development. Indigo found its luck in Kingfisher’s bankruptcy due to poor debt management, same with Jet and Go Air bankruptcies where overnight players went bankrupt and supply evaporated from market. Indigo continually gained market share with major bankruptcies. Air India has such a poor track record of customer service and aircraft maintenance which leads to constant social media publicity negatively. Naturally, this has left considerable amount of open space for other airlines to compete and Indigo is well placed to capture this demand. Air India and SpiceJet both are sitting on older aircraft which are in dire need of maintenance and refurbishment which will end up taking years due to sheer number of aircraft and cost involved. Even full service carrier space is now open for competition, Air India CEO has come out and said publicly aircraft shortage is set to last for 4-5 years. So anyone who has already ordered aircraft is taking the market share.

    Source: Revitalize Finance

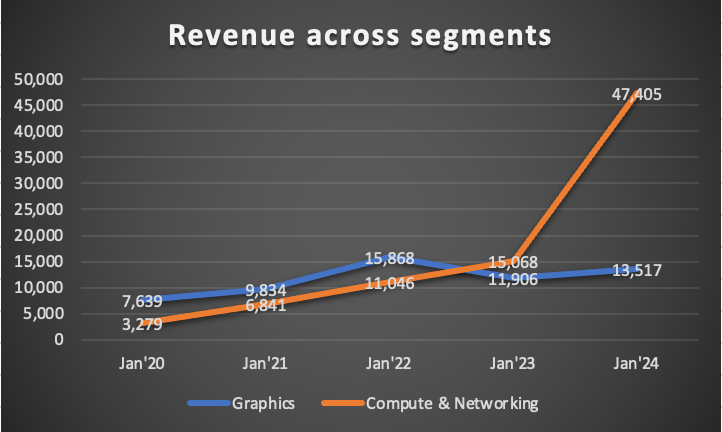
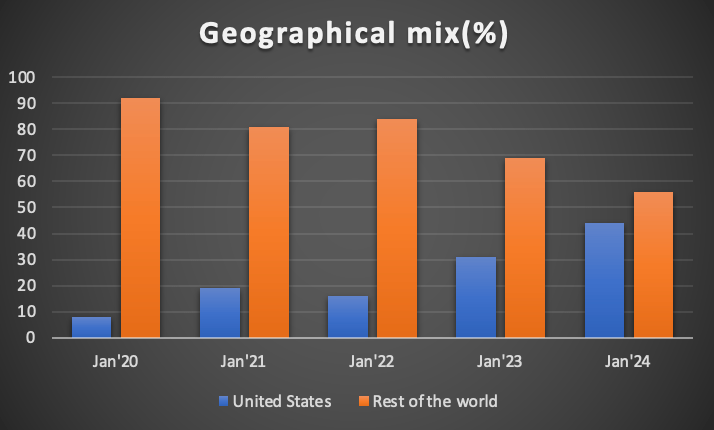
    Indigo has a market share of 65% in domestic market. Air India commands a market share of close to 27% and Akasa around 4.7%. I have not taken other airlines because they don’t offer any strong competition as of now or are operating in niche regional markets. Indigo has a strong domestic network with significant monopoly on routes based on previously reported news articles. Air India is still in the process of expanding capacity in domestic network. (Data on routes is not available freely so will recommend readers interested to look it up themselves on the internet.) Indigo is looking to expand international network as it is more lucrative yield wise, offers faster capacity expansion and helps capture entire customer journey. Indigo’s current international flying was restricted to upto 6-7 hours of flying time which is set to change as new aircraft come in. International market offers higher yields and available seat kilometres due to higher service requirements, wide body jets usually have higher number of seats in the zone from anywhere around 280 to 550 seats and fly long distances.

    Capacity expansion

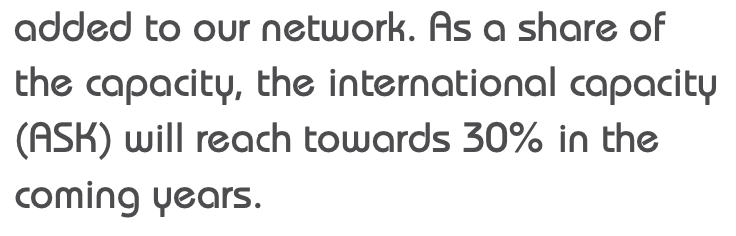
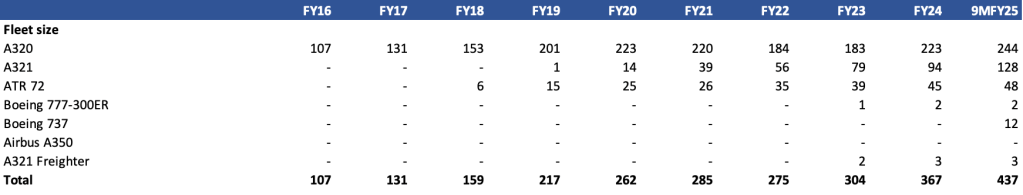
    Boeing in its commentary has mentioned delivering on average 2 planes per month for the year 2025 which means total deliveries of 24 aircraft to Air India and Akasa combined while Airbus will continue to try to ramp up its deliveries of A320neo family. This puts Akasa at a structural disadvantage. Air India and Indigo both have Airbus order books although Air India has about 340 aircraft to be delivered while Indigo is sitting at a staggering 930 aircraft yet to be delivered. Akasa has about 199 more planes on order with Boeing to be delivered over next few years while Air India has about 185 aircraft left to be delivered from Boeing side. Majority of this capacity is going to come towards single-aisle jets which serve domestic and short haul international routes. International medium and long haul Air India has a strong position due to its wide body fleet. Currently, Indigo and Air India both are under capacity constraints. Air India remains under capacity constraints as it is busy refurbishing its fleet of both narrow body and wide body aircraft which are out of service. Indigo also is currently facing issues with engines on its fleet leading to grounding of 60 aircraft which management expects to gradually reduce over next one year. Indigo is expected to induct its first A321XLR this year which will open up new routes which could be strategic in nature and give Indigo an edge or monopoly in few international routes for now. Indigo is also going to induct few 787 on wet lease basis this year to capture international demand coming out of India and to compete with Air India. It will start receiving A350s in 2027 which shall open up even more markets like North America and Europe. 787s also offer this capability and Indigo is set to use this for aircraft for European routes temporarily. Indigo has deployed first of this aircraft on Delhi-Bangkok route. Indigo’s current fleet size is expected to double by the close of this decade which means close to 700-800 aircraft in the fleet. Indigo updated its guidance on international capacity expansion to 40% of total capacity by 2030 vs earlier target of 30% in short term.

    Source: Indigo Annual Report FY24
    Source: Revitalize Finance

    Revenue and pricing power

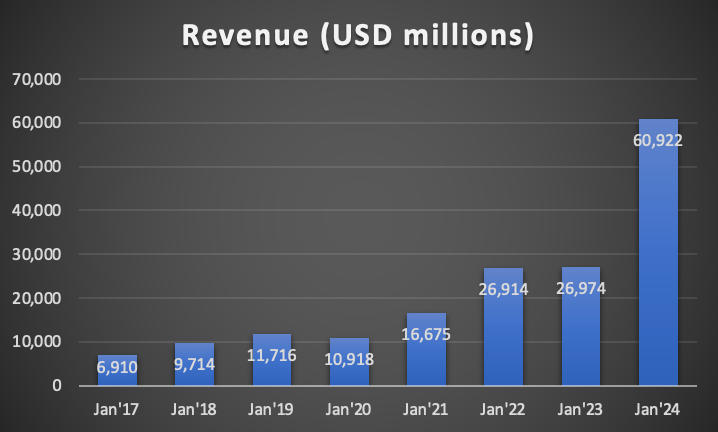
    Indigo has seen its revenue climb at almost 20% CAGR basis from FY16 to FY24. Indigo has seen total revenue go from close to 16,100 crores to nearly 69,000 crores in FY24. In the same time, yield or pricing has only climbed 3.33% on CAGR basis. Yield is basically passenger ticket revenue divided by revenue passenger kilometres or price per km of distance flown per passenger. It doesn’t include extra revenue gained from selling food, beverages or providing any additional services to passengers. More or less the split between passenger ticket revenue and additional revenue from ancillary services and products has remained the same. Passenger ticket revenue made up 87% of the revenue in FY16 which has remain unchanged at 88% in FY24. Ancillary revenue at the same time has seen slight drop from 12.40% in FY16 to 9.55% in FY24 as other part of the revenue has taken a slight share which I expect to reverse going forward as this revenue includes compensation from Airbus for grounding of aircraft due to ongoing engine issues with its fleet. Entire growth recorded by Indigo has come from volume expansion as can be seen from nearly smaller change in yield. Yield has more or less remained under pressure in India since early 2000s. Pricing power is purely dependent on the capacity, customer’s sensitive to discretionary spending and costs to put that capacity. Air India currently has older fleet which may lead to higher costs but over time with new deliveries they will also see reduction in cost base. Indigo should continue to maintain cost leadership which means it can drive pricing as well. Indigo has also started shedding its budget airline image by pushing into business class travel between major cities of India and looking to start international long haul and ultra long haul which offer higher yields than domestic market. A321XLR could offer very strong opportunities in terms of network building. Indigo has set a target to take international capacity share to 30% in near term. You could end up seeing unique flights which may not have been possible before like Bengaluru-Tbilisi or Mumbai-Seoul. These are just examples, not something Indigo is actually doing or might have done.

    Source: Revitalize Finance

    Costs and Profits

    Biggest expenses for an airline includes aircraft acquisition, maintenance & repair, fuel costs & human capital. These expenses can look different based on which region’s airline you are looking at. American companies usually show a higher expense on human capital side than fuel side as compared to other regions. This may mean not an apples to apples comparison on an international level. Lot of it also has to do with the mix of revenue getting driven by premium offerings, level of service offered, local taxes, import taxes, etc. In India, fuel cost is about 35% of any airline’s revenue, while rental and maintenance could be anywhere from 15-17% and human capital cost is around 9-13%.

    Source: Revitalize Finance

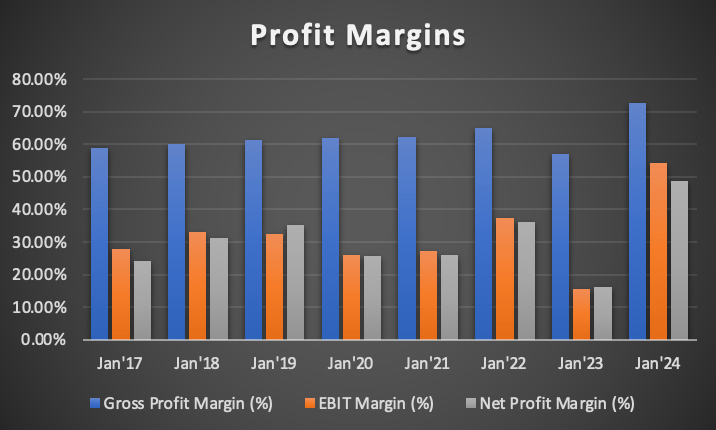
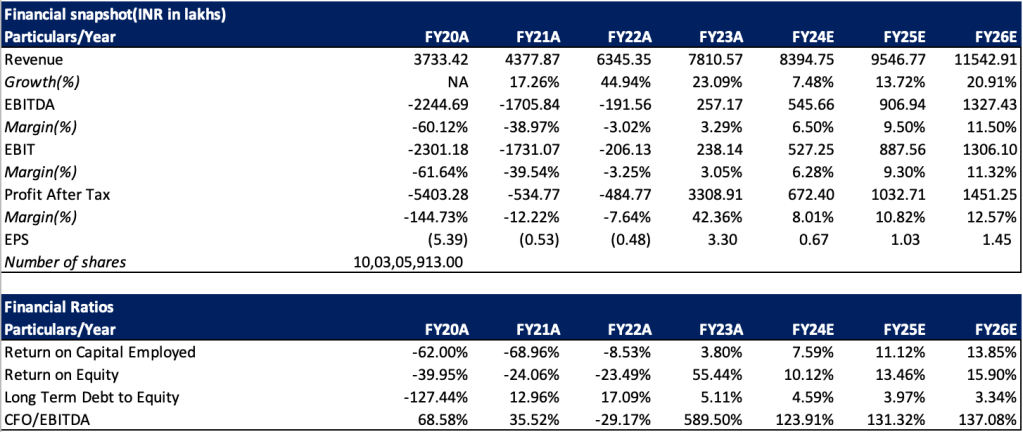
    Indigo’s gross margins are more or less highly dependent on fuel costs as compared to other costs. In FY23, fuel costs made up 43% of revenue vs long term range of 35%. As the costs fell you can see gross margins improved significantly. Almost entire improvement in gross margins has come from reduced fuel expense as a percentage of revenue. I expect fuel costs to remain somewhere around 32-35% over next 2 years due to economic slowdown and OPEC’s pledge to improve production which should support gross margins for Indigo. In the latest quarter of Q3FY25, fuel costs made up only 29% of operating revenues. This line expense can single-handedly decide the prospects of the airline. EBT margin has improved from -0.69% in FY20 to 9.35% in FY24. I expect this to remain in favour for Indigo and slightly improve as well. I have taken EBT margins as a measure of operational performance because of accounting rules.

    Source: Screener. Changes in accounting standards resulted in increase in debt to the tune of 22,000 crores related to future lease liabilities which were otherwise earlier classified as operational expenses.

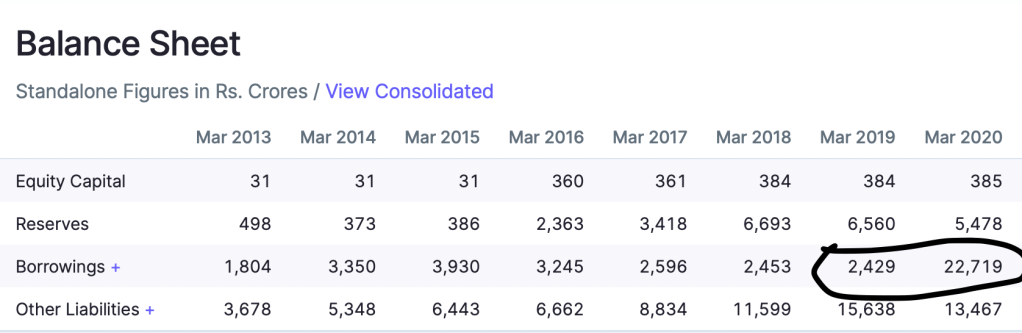
    Due to accounting changes in financial statements, FY20 saw Indigo recognising its operational leases as financial leases which has led to creation of debt on its balance sheet with a commensurate entry in the side of assets with right of use assets. Indigo is objectively debt free with some aircraft sitting on finance lease. This led to artificial escalation in interest costs and depreciation charges which impacted EBIT and EBITDA. Hence, I take EBT before foreign exchange loss and other income as a more truer form of operating performance for Indigo. Coming to profitability ratios, one has to put economic environment and balance sheet’s condition before taking high ratios as given. Covid-19 caused a significant dip in business operations and completely eroded net worth of Indigo.

    Source: Revitalize Finance

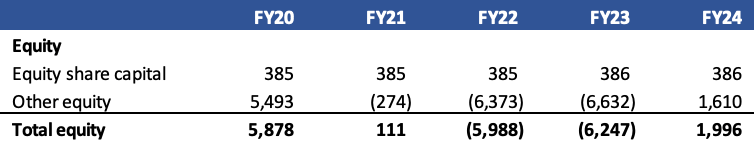
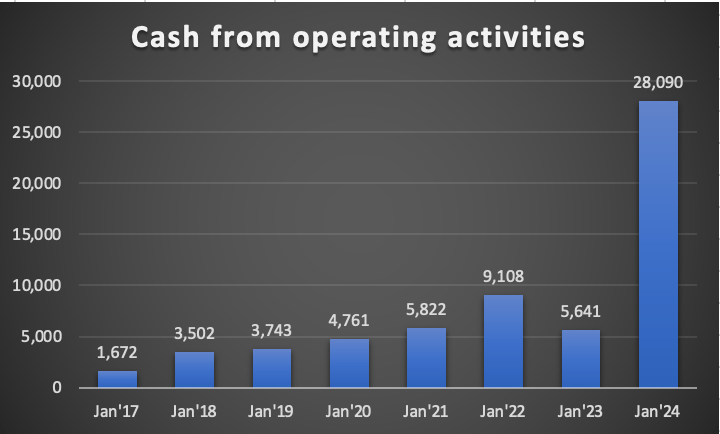
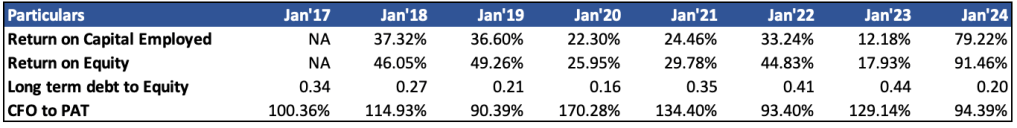
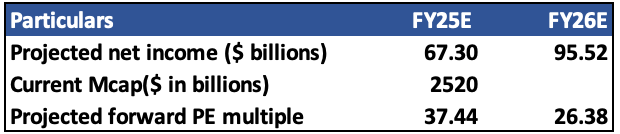
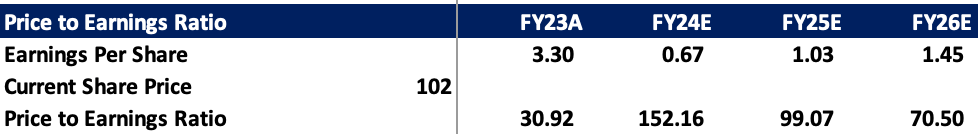
    Post Covid-19 and fall in crude price has brought the airline back in black and made net worth positive. Indigo reported a profit of almost 8,200 crores in FY24. This single year completely reversed the negative net worth of the airline. Even losses sitting in tax books is providing a lift which should completely reverse in FY26 and tax outgo should normalise by FY27. The low base effect of net worth is impacting the return ratios as of now and I expect it to eventually settle at normal levels once the base attains sufficient size commensurate with its business. Return on Equity should more or less be around 76% for FY25 vs 409% in FY24 and should keep going down. Mind you, this will be accompanied with improving EPS as well. Indigo is currently generating quarterly profit of 2,000 crores and should see improvement as the fleet expands, product mix improves and rupee depreciation flattens out. Another proof of airline’s strong profitability is in adjusted CFO/EBT. In FY24, airline had an adjusted CFO/EBT of 175%. This is more normalised and provides a far better picture of cash generation than return ratios. I have taken adjusted CFO due to accounting changes related to leases which pushed lease expenses into principal repayments and interest costs to financing outflow vs operations earlier. Therefore, I have reduced cash flows from financing from operating activities to give reader a better idea about the business and its ability to generate cash. Lot of it has to do with Indigo’s focus to keep asset light balance sheet using sale and leaseback mentioned earlier, avoiding debt fueled expansion and airline business’ natural character of taking cash before delivering services. Also I want the reader to know, Indigo’s disclosure on profits focus on EBITDAR, EBITDA and other facts. I don’t like to focus on EBITDA simply because depreciation is a cost to business and prefer taking EBIT as operating profit margin. In Indigo’s case due to accounting rules, I have taken an even more stringent metric of EBT because I think that is way more fair. (Obviously, you are free to choose to focus on EBITDAR but my focus is profits after all costs but before returns to capital providers. Any asset whether financed through self or lease is a cost to business and capital providers only get returns after accounting for these costs. You are more than open to disagree.)

    Source: Revitalize Finance. Disclaimer: This is just one scenario of the future P&L of the airline. Request reader to use it only for education purposes. Above figures are in crores.

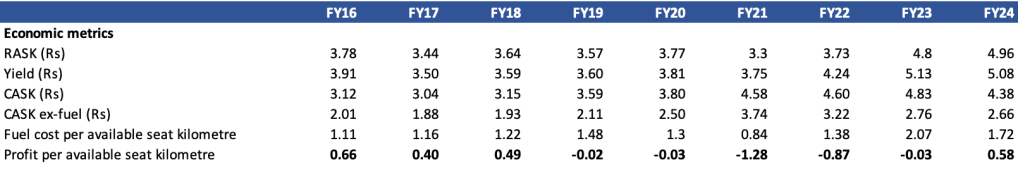
    There are other metrics as well. They give a view on the unit economics of the business. Much like hotel industry, Yield is like average room rate. Yield is price per kilometre flown by a passenger. RASK (Revenue per available seat kilometre) is like RevPAR. It is basically calculated as passenger load factor multiplied by yield. It also includes all other forms of revenue and can sometimes be higher than yield. The total revenue figure in P&L includes all operating revenue. CASK is basically cost per available seat kilometre. It is calculated in two forms one is with fuel and other is ex of fuel. Ex of fuel is a much better measure due to volatile nature of fuel. Like I said, an airline can have an extremely low cost base vs competitors but still post loss due to crude prices. Our focus is on CASK ex-fuel. Indigo’s strong focus on cost and efficiency can be seen in CASK ex-fuel. From FY16 to FY24, CASK ex-fuel has only moved from 2.01 rupees to 2.66 rupees in FY24. That is a CAGR of 3.56%. Profit per available seat kilometre (RASK-CASK) is still down though from 0.66 rupees in FY16 to 0.58 rupees in FY24 as yield climbed only 3.33% on CAGR basis in same time period.

    Source: Revitalize Finance
    Source: Revitalize Finance

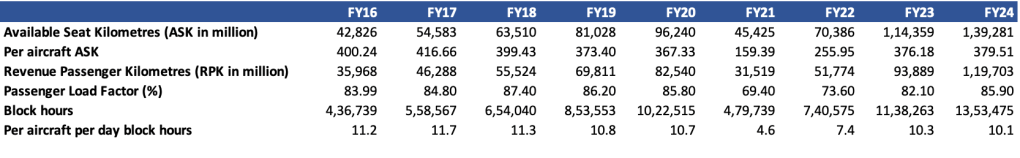
    There are certain triggers in business which should provide efficiency boosts and upside surprises. Indigo’s management has repeatedly mentioned inefficiency of aircraft usage due to congestion at major airports like Mumbai and Delhi due to capacity constraints. New airport openings at Navi Mumbai and Jewar should unlock capacities and efficiencies which should reduce fuel burn thus translating into more profits. Indigo’s entry into business class segment should also translate into upside surprises in yields. Indigo plans to eventually fit less than 10% of its fleet with its new business class product- Stretch. Despite the inefficiency, Indigo’s block hours per aircraft are down from 11.2 in FY16 to 10.1. Block hours is time from aircraft gate closure to gate opening post landing. Indigo’s efficiency can be further increased by one hour per aircraft per day. It may or may not be possible based on yields also as it increases capacity by 11% in one go. The increased utilisation can also lead to lower CASK ex-fuel. There is also an opportunity to lower CASK ex-fuel if Airbus is successful in resolving aircraft groundings and Indigo is able to give back aircraft it has taken temporarily from other airlines like 737 to expand capacity.

    Risks

    Aviation industry and stock market both are fraught with risks. There is always the risk of underperformance of the stock or the company itself giving downside surprises. Donald Trump can undertake policy measures which negatively impact India which could pull down demand and yields of the industry. Fuel costs are currently favouring the industry and could favour industry but crude is also extracted from Middle East. Any flare up in Middle East will pull the airline into losses again. Air India is aggressively expanding premium offerings in domestic route network to capture premium travellers. Air India has started offering premium economy also which is positioned between business class and economy. Indigo has not shown any interest to do the same. Delay in aircraft delivery due to supply chain woes could impact capacity expansion and push up costs. Any opening up of capacity at Boeing and Airbus will also be detrimental as space for another carrier could open up. Indian economy is also facing pressures right now due to slower growth and high debt of households.

    -Shivang Agrawal on WordPress

  • Remember the California Gold Rush? 300,000 people descended into California in 1840s to 1850s to mine gold with only few actually ending up getting rich from the gold. When majority of the population was focused on finding gold, few people like Samuel Brannan ended up being millionaire from selling supplies to the miners. Want to hear another success out of this gold rush? Levi Strauss, the famed denim jeans producer. Just like the Gold Rush, California is today seeing another gold rush but this time for artificial intelligence or AI. Google, Amazon, Microsoft, OpenAI, you name any big cloud service provider or multi billion dollar startups like Anthrophic. All of them are betting big on large language models and are spending billions of dollars each quarter to carve out a nascent but very promising and scalable market in AI. All of them are focusing on one thing and that is how to build bigger and more promising AI models but one company is squarely focused on helping these companies achieve this by being a shovel to their gold dreams is Nvidia. This article will give you both a storyline and a view of the numbers of this multi trillion dollar giant in the making to give you an idea about the scale and its achievements and why investors are bullish on this one chipmaker. If you are not interested in initial history of the company, you can straight go to the recent financial performance at the bottom and prospects of the company.

    P.S. – This article purely meant for educational purposes. Do not consider any conclusions from this blog as buy or sell decisions. Please do your own independent research for investment purposes. This blog is not responsible for any loss in investment by the reader. As a disclaimer, the writer of this blog doesn’t hold any investment in the given stock.

    The beginning of the new computing era

    Nvidia has been in the news for eclipsing the market capitalisation of companies like Apple and Microsoft. An outcome almost no one would have imagined or thought was thinkable until few years back. The AI story may have unfolded now but it was decades in the making which is what makes it even more worthy to talk about. I have always been a tech enthusiast. I have known Nvidia since a long time but could not have imagined the scale it will achieve. It was only later I realised its potential, probably because I am not close enough to developments of AI and partly ignorance since Indian markets offer such lucrative high growth stories for investing.

    Coming to Nvidia, it was started by Jensen Huang, Chris Malachowsky and Curtis Priem in April of 1993. Prior to starting Nvidia, Jensen worked at LSI Logic and Advanced Micro Devices (AMD), which is in fact the arch rival to Nvidia today. Nvidia was born out of a need to solve 3D computer graphics for the gaming and multimedia market. Imagine there were 90 startups which came up after Nvidia started, all trying to solve this problem thus commoditising the market at the onset. Only key differentiator was performance or efficiency of the chips and time to market. These conditions still stand today for the remaining players. At one point, all these startups were ahead of Nvidia and the company was close to bankruptcy. All of this changed in 1999 when Nvidia revolutionised the PC gaming market with the invention of graphics processing unit. There are some subtle differences between what Nvidia developed in 1999 vs initial development of graphics card before 1999. You can look up the history to understand more. How exactly did GPU change the landscape? The CPU in a PC is responsible for diverse variety of tasks and cannot handle large amount of arithmetic tasks simultaneously. It has limited number of cores or essentially limited amount of workstations with diverse skills to allocate for running applications. GPU accelerates this by offering thousands of cores and shared memory for the application to run on. Imagine thousands of workstations with one single focus to solve mathematical problems fast. It has been designed to optimise the performance of compute intensive applications like games or generative AI. Both these applications require simultaneous or parallel compute capabilities to render images or graphics or ability to reply on ChatGPT fast enough and in a very energy efficient way. You can say CPU can handle diverse variety of tasks while compromising on efficiency but GPUs are specifically meant to solve this parallel compute ability. CPU can handle the overall application but uses GPU’s capability to perform functions extremely fast and at acceptable time limits. It saves power and delivers the task much efficiently.

    Another foundation of AI development: CUDA

    Nvidia’s AI dominance doesn’t just come from GPUs. AMD and Intel both offer GPUs. There is not much to differentiate here. Differentiation comes from the software stack on top of Nvidia GPUs. This software stack is known as CUDA or Compute Unified Device Architecture and is proprietary to Nvidia GPUs. This software allowed researchers and developers direct access to Nvidia GPU’s parallel compute capability which the competition didn’t develop at the time. Nvidia brought this ability to market in 2006. This was a conscious decision taken by Jensen in early 2000s after watching the industry. Till date, there aren’t strong alternatives to this entire development ecosystem. To make sense of this, CUDA offers low level programming without which acceleration isn’t possible. Intel and AMD both offer GPUs but don’t offer any such product and without this optimisation it leads to significant overheads. Nvidia has optimised it very well. Nobody could have imagined it then how this move would have changed the trajectory of companies involved in the same industry. This software allowed GPUs focus to expand from gaming and content to general purpose accelerated computing. Tasks which could take weeks or months on CPUs could be done in GPUs in days. Imagine the cost and time savings. Earlier CUDA was focused on making GPUs as scientific hardware with focus changing to neural networks in 2015. Even he couldn’t have imagined the scale it will achieve since scientific computing was a very small market. Competition has developed their own software stacks to compete with Nvidia but they were very late to market and the lead which Nvidia has established over the last 18 years is paying off today.

    Call it luck?

    In 2012, far from Wall Street or mainstream tech. Nvidia’s GPUs were used to win a research level competition in image recognition. The trained algorithm, known as AlexNet, showed marked improvement in performance in image recognition and it became the pivotal movement in the history of deep learning. After this, doors to deeper AI research opened and other problems seemed solvable. It was the approach to solving the AI related problem which changed the fate of technology industry and Nvidia. They used two Nvidia GPUs to perform the computationally intensive task which previously seemed impossible. Nvidia’s efforts to focus on opening up itself aside from gaming to general purpose accelerated computing for the scientific field while others were too focused on billion dollar opportunities in gaming world led it to secure itself as the technology partner towards the dawn of deep learning. Since then, AI developers are focused on developing for Nvidia GPUs and the ecosystem continues to grow. Today, CUDA composes of entire development ecosystem which simply make it the top choice. There is simply no alternative. If you want to understand more, I have given links to two articles on the internet which will help you dive a bit deeper into Nvidia’s moat. (https://www.nytimes.com/2023/08/21/technology/nvidia-ai-chips-gpu.html, https://www.turingpost.com/p/cvhistory6)

    AI today

    AI today essentially is focused on deep learning. It is a subset of machine learning and AI where the algorithms focus on learning from raw data just like humans, look for patterns and try to mimic a human brain in software. This is called a neural network and today this forms the basis of ChatGPT, self driving cars and much more. From AI development of view as an investor, you can divide the market into two halves. One is training and the other is inference. Training is a phase where the model learns from the training data and tweaks its parameters and weights to minimise the errors in output. Inference is when the trained AI model is deployed for use. You need chipsets for both the categories. Training is more computationally intensive than inference but the scale of inference can be huge due to repeated usage of the model. Imagine ChatGPT processing millions of requests each day using inference.

    Nvidia today

    Nvidia today holds a dominant market share of AI hardware market. Estimates range from a 75% to 90% market share in AI chip market for Nvidia. It is a fabless chip company mainly focusing on chip design and development and outsources production to TSMC. The company has a clear moat in the market with top tech companies choosing Nvidia for their needs and its products simply being better than competition. It seems from the market share data that there is a clear advantage Nvidia has above its peers and is expected to maintain the same. ‘For every $1 spent on an Nvidia GPU chip there is an $8 to $10 multiplier across the tech sector,’ according to an August report by investment firm Wedbush. Companies are spending ten of billions of dollars every quarter to ramp up AI hardware in their data centres and this is being currently led by world’s biggest tech companies, in particular, Google, Microsoft, Amazon and Meta. You can see the capex being undertaken by these companies to build data centres as they provide AI solutions to their clients as cloud service providers and for captive consumption as well. Apple is set to bring AI features to its millions of iPhone users this year with Siri getting integrated with OpenAI’s ChatGPT. (I have put a link below for readers to grasp the scale of this trend –https://www.hindustantimes.com/business/heres-how-much-big-tech-giants-like-google-microsoft-apple-and-amazon-spent-on-ai-101722407832742.html). The trend of AI capex is broadening with countries and companies from other sectors also now jumping on the bandwagon. Traditional IT service companies are also now pitching enterprise AI solutions to clients as businesses are forced to upgrade their technology infrastructure to match the needs of tomorrow. About a trillion dollar worth of infrastructure needs upgrade and all of them will be built with GPUs to accelerate computing. Currently as per Nvidia world is transitioning from general purpose computing to accelerated computing and human software developers will be replaced by AI lead code development. Think about the scale here? India employs millions of software engineers from which a subset or possibly even more are on track to become obsolete and this development is through AI-led data centre boom. Future AI models are going be even more computationally intensive with next generation models being 20-40x more intensive than existing ones.

    Concentrated revenue but big cash flow with clear moat

    Nvidia’s revenue has blown up post 2016, it was a high growth company before the AI race but the launch of ChatGPT in November 2022 kicked off an arms race in AI. Lot of companies and countries were caught unaware with the release of ChatGPT and its capability. Just for the measure Nvidia’s revenue went from close to $7 billion dollars in fiscal year 2017 to almost $61 billion dollars in fiscal year of 2024. Its turnover grew by 8.8x in 8 years! One has to remember their GPUs aren’t cheap. A Nvidia H100 can cost more than $40,000 a piece. Tesla is reportedly set to increase its 35,000 H100 GPUs by 50,000 to 85,000 GPUs by the end of this year. You can see how quickly these numbers can add up when global capex takes off.

    Nvidia’s consolidated revenue from form 10-Ks filed with US Securities and Exchange Commission over the years

    Nvidia has two reportable segments with Graphics and Compute & Networking being the other. Graphics segment is mainly concerned with gaming, VR, metaverse and visual related revenue. Compute & Networking is concerned with data centers and networking platforms. From enterprise cloud to automotive AI related revenue comes under this segment. Nvidia by nature has been cyclical company due to the nature of its end customers. Even the current capex boom is suggestive of the same but the difference lies in the longevity and scale of the data center capex boom. Demand for GPUs is only getting stronger.

    Nvidia has two reportable segments as per 10K filings

    Nvidia’s geographical concentration has grown over the years. With United States forming an increasing part of the overall revenue mix. This is indicative of the capex being undertaken by Magnificent Seven in the US. Interestingly, capex seems to have taken off in the rest of the world as well.

    Customer concentration risk has grown for Nvidia. As per their regulatory disclosures, this risk was very minimal until few years back when no single customer had an outsized impact on revenue which has materially changed over the last two years.

    Nvidia’s customer concentration as of July 2024

    Let’s talk about profitability and cash flow. Revenue growth of tens of billions alone can’t pull the company to big leagues of Apple and Microsoft. Nvidia has the world’s best set of margins any business can have. It has a gross profit margin of more than 72% with operating margins of 54% and net profit margins of close to 50%. This wasn’t the case in 2000s but is definitely indicative of the strategy paying off and the competitive moat company now surrounds itself with. Company has clearly seen a sustained structural expansion in gross margins and operating leverage benefits playing out over last few years which is highly indicative of the moat the company has built. Have you ever seen a hardware company command these high margins at such a huge scale? Gross margins have improved from 58% to 72% by FY24. In FY23, company had a failed acquisition with Arm which resulted in acquisition cost of $1.35 billion and a ramp up in operating expenses due to research & development costs. Just for knowledge, R&D makes up 76% of the operating cost base. Total operating costs sit at 18% of the revenue as of FY24. Total operating expenses have shrank from 30% of revenue in FY17 to 18% in FY24. Margins though have been volatile in between.

    Cash flows have seen a fast rise commensurate with the growth in revenue and profitability. Nvidia has not seen much improvement in its working capital cycle with accounts payable continuing to remain flat at 4% and accounts receivables seen big increase from 8.3% to 15.2% from FY17 to FY24. Inventories have remained flat at 8%. Nvidia has returned significant money to shareholders by buying back shares and giving dividends with majority of the money being returned through buybacks. In last 2 years, Nvidia has spent close to $20 billion dollars returning money to shareholders. It has further announced additional plans to buyback $50 billion dollars worth of shares.

    Nvidia Cash Flow in $ millions

    Prospects – risk or reward?

    Nvidia is a one stop shop for data center needs of big tech, enterprises and accelerated computing needs. It offers entire stack of data center from GPUs, frameworks, software to networking needs inside the data center. Nvidia undertook acquisition of Mellanox for $7 billion dollars to strengthen its data center offering. Looking from an investing perspective, risk and reward need to be discussed. Nvidia has a lot going for it and there’s more to come.

    Opportunities for Nvidia

    Nvidia is positioned in a market where competitors are entering to chip away or grab some part of this revenue to challenge Nvidia. One has to think about the entire ecosystem which needs to be built around hardware and software, along with the developers to develop such a strong ecosystem and go to choice for data centre customers. Startups and companies from Amazon, Google, Microsoft, Apple and others are all trying to develop custom AI based chips for their data centres to reduce their costs. Remember the gross margins?. Nvidia still continues to lead and will maintain its lead for years to come. Google currently offers its own chips through only Google Cloud. Amazon has developed its own training and inference chips for AI models for customers. Nvidia is also much stronger at training than inference part of the business. You can see some competition prop up to specifically target inference based chips as Nvidia is not as good there. Competitors like Groq and Cerebras are building inference compute solutions which Nvidia isn’t doing. Reward overall continues to remain favourable for Nvidia. There will be more opportunities which will unlock over next few years with software engineers who are squarely focused on low end coding to be replaced by AI. Self-driving will require data centres. Enterprise AI is just getting started. The investment case right now is purely based on optimism the world will undergo a major shift as AI penetrates deeper into workplace and consumer economy. Google’s search engine is under pressure as well from LLM based search engines. OpenAI is vying for this market. SearchGPT was launched as a prototype in July, 2024. In consumer tech, smartphones have been the first products to receive new AI related features. AI features currently don’t offer much value on smartphones based on early reviews. It will be over time as new use cases develop the AI may become more central to entire smartphone ecosystem. Google’s latest Pixel 9 lineup offers strong AI features like Gemini which come with real time image generation capability and voice based AI assistant. All are paid features. Risk is also on the side that development cycles are shortening for these data centre chips. Nvidia is reducing the time to market for these chips and developing them faster than before which brings newer sets of risk.

    Financials and management commentary

    Nvidia is a very high quality company with strong financials and strong cash flow. The problem lies in the industry it operates, mainly gaming, data centre and cryptocurrency mining. Gaming and cryptocurrency markets both have shown to be historically volatile in nature from revenue point of view. If one has seen the graph of graphics revenue segment, the cyclicality is clearly visible. Compute & networking is showing one side drastic increase which is purely driven by capex being undertaken by big tech and countries. How long will this capex last is highly dependent on how fast new AI models make it to market and how good is their adoption. Are consumers and enterprises willing to pay extra to bring these AI features into their workflows? Short term capex seems to be visibly strong as can be gauged from the growth rates and management commentary. Nvidia is currently rolling out H200 chips and is producing Blackwell platform which is expected to ship later this year. The chip has 208 billion transistors, 128 billion more than its Hopper predecessor, is capable of five times the AI performance, and can help reduce AI inference costs and energy consumption by up to 25 times, according to Nvidia. Naturally, whoever gets them first gets a cost advantage. They expect to ship several billion dollars worth of Blackwell in Q4 of FY25. Nvidia also expects gross margins to expand to 75%, slightly higher than 72.7% in FY24. Operating margins will expand significantly due to better gross margins and operating leverage benefits. Nvidia has already booked almost entire FY24’s revenue in H1FY25. The company is on track for a revenue of $32 billion dollars in Q3FY25 and should close above the same figure in Q4FY25, which means revenue will end up doubling year on year to $120 billion dollars plus.

    Valuation & Return ratios

    I have estimated a revenue of $186 billion dollars for Nvidia in FY26, giving them a growth rate of 50% due to the continued capex from big tech, added opportunity of countries doing AI capex and Blackwell ramping up through 2025. I cannot stress enough that company may experience cyclicality as investors and big tech may give a pause to AI capex due to slower returns from this capex than anticipated. Company also has seen reduction in China business due to trade restrictions with revenue falling to single digits as compared to double digits before. These trade restrictions could continue to rise due to US-China trade war and US attempts to stifle China’s AI progress. Profitability and cash generation will favour Nvidia as operating leverage benefits further come in and company gets a huge boost in revenue. With bottom line expanding from 49% in FY24 to 54% in FY25 and expected to remain flat to slightly decline over FY26. Blackwell is reportedly priced slightly higher side than Hopper architecture which should positively support margins or give an upside surprise.

    Source: Revitalize Finance

    The current bullishness in the stock and with the anticipated Federal Reserve rate cut, valuations for Nvidia could sustain. The stock has faced a decline due to Department of Justice antitrust investigation. Although unfair trade practices have been claimed by DOJ, there aren’t any competitive alternatives to Nvidia and the company is operating like a monopoly at the moment. Investors will be paid to track the management commentaries of big tech and enterprise IT companies. Even if Nvidia fails to deliver on revenue growth projections, the company has a big stock buyback plan approved with upto $50 billion dollars worth of stock which will be bought back. Post this AI capex, Nvidia could see growth falling to lower double digits or even lower, depending on AI investment payoff for end users. Another downside risk could be the huge margins company is reporting. Demand is currently strong which maybe strongly playing a role in the margin profile of the company. Although I don’t see a fall in gross margins for now, opex may get hit or gross margins may take a hit due to production issues with new Blackwell processors or demand simply fails to pan out the way Nvidia estimated. Historically GPUs have seen price fluctuations and overall semiconductor industry is prone to pricing erosion at times. Technological change could be big risk for Nvidia. Open source GPU programming might kill the competitive moat of Nvidia . If open source GPU programming indeed becomes a viable alternative, Nvidia could see fast erosion in margins and market share. Nvidia has strong cash flows with a strong moat and very high quality business well placed to capture AI wave for the foreseeable future. Any dips in stock valuations could present a nice opportunity for investors to ride on the growth wave with a big scale company like Nvidia.

    -Shivang Agrawal on WordPress

  • India’s startup ecosystem has seen its fair share of success and failures. It has seen success of e-commerce with Flipkart becoming the homegrown alternative to American giant Amazon while it has also seen spectacular failures in big unicorns like Byju’s. All in all, India continues to remain a bright spot in global startup investing. India has built notable names globally and one more industry where India could shine is the private market data industry with India’s answer being Tracxn. It is a platform which operates globally and is a homegrown entity involved in private market data for investors like private equity funds, venture capital funds, M&A units of large corporates, universities & many more different type of customers who may need such data. It is a direct play on the growth of the private financing industry.

    P.S. – This article purely meant for educational purposes. Do not consider any conclusions from this blog as buy or sell decisions. Please do your own independent research for investment purposes. This blog is not responsible for any loss in investment by the reader. As a disclaimer, the writer of this blog doesn’t hold any investment in the given stock.

    The business model

    Tracxn is a comprehensive platform tailored for private market company data and intelligence. Think about PE investors, they require information on prospects, from financials to shareholding. Tracxn acts as a one stop portal which provides information of private companies to prospective investors. The information can range from shareholding, cap tables, competition, financials, valuations, transactions and more. It also provides information on fund performance of different private market focused funds like venture capital and private equity to prospective investors. This service becomes valuable as it helps save time and improves discovery side for funds. Lot of manual work gets automated for analysts and investors. Tracxn generates revenue by selling subscription of its platform to clients ranging from private market investors to corporates, universities and any prospective client who may need such information.

    Just to explain the value chain of the industry. Investors in a private equity fund or venture capital fund is known as limited partner. They range from insurance companies, sovereign wealth funds, university endowments, ultra HNIs and more. The funds pool this capital from different partners and then find prospective companies in private market to buyout or invest in. The fund is generally managed by someone known as general partner and looks after the complete operations of the fund. Private equity funds usually deal with companies which are already mature and can be taken for an IPO or sold to another PE investor or any strategic buyer. PE funds try to extract value from investment by cutting costs in companies and loading them with debt on purchase, also called, leveraged buyout. The cash flows of the company are used to payoff the debt taken to finance the purchase. In venture capital world, the only thing which changes is that VCs focus on funding companies which are new or also known as startups. Their payoff depends on investing in several companies with most of them going bankrupt with few of the winners more than making up for losses and giving decent returns. VCs also provide strategic advice and consulting to startups to help them scale up. PE funds and VC funds are highly dependent on public market performance and other funds to exit their investments which means if the funds are holding low quality businesses or caught in wrong side of the cycle can face potential destruction of returns or bankruptcy as well. Tracxn enters in the value chain at both LP level and fund level by providing intelligence.

    Side note:- Cap table is a document which contains and details ownership of company and becomes valuable for prospective investors to make investment decisions.

    Market size scope

    Private market asset management industry managed close to 9.6 trillion dollars during 2021 and recorded a growth of 12% on CAGR basis from 2015 to 2020. The industry is expected to hit a size of 12 trillion dollars under management by 2025, posting a growth of 11.7% on CAGR basis from 2021 as per report from Frost & Sullivan. The number of addressable market for private market data platforms stands at 100,000 organisations at a global level. These include investment banks, private equity funds, venture capital funds, corporate M&A departments of large corporates, universities, etc. Number of PE firms has grown from 7,800 in 2015 to 19,512 in 2021. Number of investment banks has also grown from 6,058 in 2015 to 11,923 in 2021. Number of VC funds has grown from 12,873 in 2021 to 27,506 in 2021. Total available market size stood at 2.58 billion dollars as of 2021. It refers to the market that has not yet been fully penetrated and still has opportunities available. Total addressable market stood at 1.19 billion dollars in 2021. It refers to the market that is being serviced by private market data players currently. Currently private market investors make up about 55% of the total addressable market while corporates make up about 31% and rest is accounted by others as of 2020. North America makes up 44% of the total addressable market, EMEA (28%), APAC (26%) and RoW (2%) as per 2020. According to Frost & Sullivan, market penetration is expected to improve from 52% in 2020 to as high as 65% by 2025.

    Business – Description, Competition, Strategy & Prospects, Financials, Investor Mix, Risk-Reward equation

    Description

    Tracxn was founded by Neha Singh and Abhishek Goyal in 2013. Both of the founders belong to venture capital world. Neha came from Sequoia Capital while Abhishek was with Accel Partners. Tracxn is entirely based in India while all its competitors are based overseas. Company generates revenue from subscriptions by selling quarterly and annual subscriptions to its platform. In FY23, annual subscriptions made up about 63% of the total subscriptions mix. Tracxn platform collects data from world over using government filings, digital footprints of companies and over 750 mn+ domains across emerging technology sectors. Company’s advantage resides in its tech stack and being based in India. Company’s operations are asset light but highly dependent on employee cost as it makes up about 89% of the cost structure hence the advantage of being based in India. Cloud hosting charges is the second largest expense in the cost structure and makes up about 3% of the cost structure. The key metrics to understand this business include number of accounts, number of users, entities profiled, daily active users and monthly active users which give you a sense of the economics of the business. Platform’s value will keep increasing as more data is added on the backend and network effects start kicking in as more players start to use the platform. On the backend, Tracxn tracks more than 500 million entities while the number of entities profiled on the platform has increased from 1.9 million in Q2FY23 to 2.5 million in Q3FY24. Number of customer accounts has grown from 1155 in Q2FY23 to 1224 in Q3FY24, although number of customer accounts saw a dip in numbers in previous quarters after recording growth. Each customer account gives access to multiple users. So one single entity takes one customer account and as the research team expands more users are added for a smaller fee relatively than the first account. Average realisation per user is at 2.4 lakhs per year. First user price stood at 5 lakhs per year. Average realisation per account stood at 6.9 lakhs per year as of Q2FY24. As an investor, you need to understand account growth will lead to faster revenue growth because initial cost of gaining access to service is higher and as you add users the cost per added user falls to an extent. Thus if company chooses to grow existing accounts, it will generate slower growth as compared to getting new customers in which will lead to higher generation of revenue growth. Another key metric to track includes employee strength as the business model requires interaction with customers to onboard them and continually service them. Also, the business requires backend team on both technology and data to maintain the platform and increase its value. I have provided the data on employee strength breakup and other metrics below.

    Source: Company filings, Revitalize Finance

    Source: Company filings

    Competition

    Tracxn’s competitors mainly include overseas players like Pitchbook, Crunchbase and CB insights. Pitchbook was acquired by Morningstar. International players are few times bigger than Tracxn. The platforms have their own unique USP as per management which means the overlap between products is on a lesser extent. In total, there are 6-7 players competing in same space. Tracxn holds a single digit market share in the industry and almost all other players as well hold single digit market share in the industry. Tracxn might hold some pricing power due to its unique offering. Tracxn’s main focus has been on emerging technology sector. Company is also seeing decent customer retention at 75%.

    Strategy & Prospects

    Tracxn’s strategy has been to grow both users under existing accounts and acquire new customer accounts. Growing users within a customer account has limited scope and is dependent on fund size. Also, Tracxn’s coverage of international markets also will be influential in maintaining growth rates. Bulk of the customers are using the platform for the first time. International realisations are 1.5x of India. Tracxn’s management expects existing customers to grow at low double digits while main growth is expected to come from new customers. It will pay to watch out how Tracxn is able to grow its international revenue due to the sheer size of overseas markets and higher realisations. International revenue makes up 70% of revenue as of FY23. Company does not have any marketing cost as it relies on lead generation by distributing its own data organically through news articles and other sources. Management has showed willingness to explore inorganic expansion initiatives and is expecting costs to remain under control with increase in revenue. Company is also doing account tightening right now which is leading to reduction in customer accounts. Currently, IB fee is at 10 year low, global tech funding is at 5 year low and unicorn creation is at a 7 year low, suggesting the cycle maybe close to bottoming and growth should eventually pickup. Management is forecasting revenue to grow faster and eventually touch 30% growth mark and costs to grow under 10% mark for next 2 years, suggesting margins have ample scope for expansion.

    Financials

    Company’s sales has grown from 37 crores in FY20 to around 78 crores in FY23. FY24 revenue estimated to be around 84 crores, growing about 7.6% year on year. Revenue is fairly diversified as is visible above with number of customer accounts. About 31% of turnover is generated in Americas, 32% in India, 27% in EMEA and 10% in APAC (ex India). Clearly, Tracxn’s penetration in India is way higher than Americas, despite Americas being the top biggest market for PE and VC funds, which indirectly suggests Tracxn’s market share is way higher in India as compared to Americas. India was the fastest growing market in FY23 for Tracxn at 32% while Americas stood at 30% and EMEA was a dismal rate of 8%, more or less reflection of startup momentum and economic problems in Europe and Middle East. APAC still put up a decent show at 18%. Management is forecasting a growth of 30% over next few years eventually which seems achievable, although growth has gone down significantly lately due to issues in private market after US Federal Reserve and global central banks increased interest rates significantly and caused a drop in valuations of startups. This suggests industry is cyclical and as company grows in size, future economic woes may have much larger impact. Bulk of the revenue is generated in USD means any deprecation or appreciation in Indian rupee against USD will impact the topline.

    Tracxn as a business generates cash flow before providing service because it is selling a subscription to access the platform which makes it a negative working capital company. Any business which gets paid upfront before providing good or service is in a very good position. Even with this approach, Tracxn has seen some receivables build up in balance sheet to the tune of 10 crores in FY23. Nothing concerning as percentage in balance sheet has stayed constant more or less but this suggests Tracxn is offering some of its clients credit to use the platform. Debtor days has not seen much change in trend at around 40 days.

    On the cost side and profitability side, EBITDA margin expanded from -60% in FY20 to 3.3% in FY23 and is further on the side of expansion as operating leverage benefits start kicking in with latest quarters recording margins around 8-9% at EBITDA level. I expect margins to continue to expand as business gains momentum but company’s major cost which is employee cost has seen some expansion not at same pace but enough to warrant some caution. Management currently compensates senior level management with ESOPs in place of bonuses which is causing expansion in share capital and is also visible in reduction in promoter stake by a very small percentage without any sale by promoters. Another key risk metric will be profitability. Tracxn had seen reversal of IPO expense in FY23 which has caused margins to become abnormal(around 42%). This will reverse back to around 7% for upcoming financial year. This places significant downside risk on valuation as there is no scope for error left with the company trading around 156 PE as of FY24 estimated earnings. EPS has fallen from 3.30 rupees per share in FY23 to around 0.67 in FY24 (Please note this is estimated EPS for FY24). Since the business is not capex heavy, almost all types of costs are visible on the P&L itself and means any profit generation that takes place becomes free cash flow and available for distribution and share buybacks.

    Source: Revitalize Finance

    Investor Mix

    Both the promoters also hold similar stake in the company. Abhishek holds 17.60% while Neha holds 17.33%. Neha is the chairperson and MD while Abhishek is is the vice chairman and executive director. FIIs hold about 3.37% and DIIs hold close to 13.36% as of December 2023 quarter. This is down from 22% in December 2022 quarter. Tracxn was also backed by Ratan Tata, Bansals of Flipkart, Elevation Capital, Sequoia Capital, Accel and many more prominent investors during its early days.

    Risk-Reward Equation

    Risk reward equation might not favour investors at the moment due to the high valuation with no room for error. Company is reporting high single digit growth and current valuation is completely dependent on margin expansion and growth in turnover. The growth needs to hit the 30% mark as the management is suggesting to reduce the gap in valuation and fundamentals. Company is currently sitting at a forward PE of 99 for FY25’s estimated numbers, assuming growth picks up to double digit and company sees continued margin expansion. Any delay in growth pickup or slower expansion in margins will open up major downside scope for the valuation. What will work in investors’ favour is the economic environment which seems to have started recovering with speculative assets like bitcoin rising significantly and IPOs roaring back in India. EMEA region growth, faster than anticipated expansion in margins, changes in ESOP policies and any management specific actions like share buybacks, announcement of dividends and inorganic acquisitions might help maintain the current levels of the stock. Of course, do your own analysis and again this isn’t a buy or sell recommendation.

    Source: Revitalize Finance

    -Shivang Agrawal at WordPress

  • Right now, there is a lot of speculation that Chinese yuan or renminbi will replace the US dollar as the most dominant global currency for central banks globally. There are some seriously strong reasons for that argument and they do hold merit. Let’s see how the Chinese currency competes with US dollar.

    Central bank power

    We all know China is the world’s largest producer of goods and services and is on track to become the world’s largest economy. US on the other hand is witnessing a fall in its economic growth rate. However, worldwide financial market transactions are carried out in US dollar. The reason for this is three fold- stability, predictability and transparency. To truly understand what I mean by globally dominant currency we need to understand the power and influence of dollar. Today, US is in a position where it doesn’t have to maintain forex reserves(it stood at 129 billion dollars vs China’s 3.1 trillion dollars as per 2020). The reason for this is that, the US is the largest consumer market today. Another reason is that whenever any crisis takes place in US or other country which can impact economic growth the first and foremost reaction which you will normally notice is that investors run towards US government securities or better known as US treasuries. If you know anything about finance theory on interest rates globally the most safest instrument happens to be the US treasury securities and it acts a base over which all rates are decided based on credit risk, liquidity risk or any other risk. This is entirely perception but this perception is again backed by the three factors I mentioned. Also, the dollar helps US achieve its economic and political goals globally. The economic clout of the US forces businesses, central banks and investors globally to follow what US says or does and it’s evident when US places sanctions on different regimes.

    China is now making efforts to make its currency the globally dominant currency. In 2015, IMF added Chinese yuan to its list of elite currencies which are part of central bank reserves which includes the US dollar, Euro, Japanese yen and the British pound. To be globally dominant the country should have economic clout , dominate politically and have trust of investors. Let’s see what component of central banks reserves does US dollar and Chinese yuan make up since this metric is highly influential in determining which currency is perceived to be strong. At the end of 2020, Chinese yuan made up 2.25% of forex exchange reserves of central banks globally. Meanwhile, US dollar made up 59% of central bank reserves(lowest in 25 years). It had a share of 71% in 1990 when euro was launched.

    Credits: Google

    China’s economic power

    I think its safe to say China is economically powerful and has the potential to beat US in coming years as its size expands further. We need to look at both positives and negatives. The positive is the manufacturing capability, the infrastructure and technological progress China is making. Due to the manufacturing capability, Chinese goods are demanded world over which means the currency will remain in high demand and with growing economic size, consumption will cause foreign investments to only increase going forward and increase in trade. There are three major negatives of China which should make investors jittery. One is technology, China needs access to American and European semiconductor technology to keep its tech products competitive enough in global marketplace. Chinese companies are losing access to important technologies in this area( Huawei case in point, US sanctions decimated the smartphone business of Huawei completely). Chinese efforts to develop semiconductor technologies has failed miserably. Second, the debt funding which has taken place to support years of growth in Chinese infrastructure post financial crisis of 2008. Nobody truly knows the extent of debt Chinese regional governments have taken. There is a high chance of hidden debt due to lack of transparency. The most important thing, China is now making a switch to shift its economy from investment driven to consumer driven. The challenge here is Chinese savings rate are highest in the world with 45% income saved. Household ownership costs are running very high (many Chinese now own two homes but with no one to rent to and stock market penetration is low at 6% vs US where it is 55% and real estate still remains the main vehicle for wealth creation) , Chinese have a culture where young people need to have a house for being eligible to marry and real estate prices have become unaffordable in major cities with a major bubble waiting to burst unless incomes rise significantly to justify the real estate prices. Chinese home ownership rate is already at 90%. All in all, the trend still supports China economically.

    Credits: Google

    Political domination

    Politically, China is losing its power as the world has turned its perception to extremely negative against Chinese. With trade wars and sanctions being fired from both sides, the situation has only deteriorated from 2018 and Covid-19 gave it the one last final blow to damage it completely. China’s debt trap diplomacy has lead to cancellation of several multi billion dollar projects globally as well. Even China is now becoming more inward with its policies and wolf war diplomacy. Vietnam, an authoritarian country is skeptical of China and is increasing its ties with US. These trends don’t support the ambitions of a currency which is supposed to go global. US had outstanding political clout when US dollar was made the globally dominant currency. Also, to block the rise of China, West and China skeptics can stop purchasing yuan denominated assets for foreign exchange reserves. There is no authoritarian country in the world large enough to support Chinese cause.

    Credits: Google

    Trust of investors

    This is ultimately the most important thing. What kind of trusts investors have on China and its economy? Three things matter here- stability, predictability and transparency. Stability wise I think China deserves the credit as Chinese economy has been stable and its moving towards becoming the developed country status. Plus, the peg on Chinese currency exchange rate with US dollar makes it less risky, however, yuan needs to be freely floating to deserve the globally dominant status. Chinese exports are competitive today because of the currency peg. Once it becomes a free floating currency there is high expectation of export power erosion in China. US dollar has been freely floating and has managed to hold its own and its because of stability and trust investors have on US economy. The biggest test will be when yuan will be able to freely float without state intervention. There is opinion among market players of significant undervaluation of Chinese yuan. Chinese economy predictability wise has taken a hit although not a bad one since the regulatory crackdown on education and tech sectors which spread the rout to other sectors as well. This is more temporary in nature but assumes significance since China is altering the social structure and population goals with this crackdown and begs the question will China undo some reforms associated with market economy to achieve socialist goals. Transparency is a big question mark in my opinion as the Chinese housing bubble has not been allowed to burst which puts a big question mark on future wealth of Chinese consumers which is highly concentrated in real estate. Consumers can only spend money if they feel safe about their net worth and incomes and if there is a major artificial intervention stopping a bubble from bursting the problem will only grow. Chinese home ownership rate is at 90% and Chinese population is still going after real estate investments (evident in appreciating prices and general trends visible in Chinese economy) above stocks ( stock market is highly volatile) and other financial instruments.

    Credits: Google

    Conclusion

    If China maintains its trajectory of economic growth and keeps reforming its currency controls there is a high chance Chinese yuan could end up becoming globally dominant. Investors need to remember Chinese middle class will fuel the consumption market of China which will be much much larger than the US consumption market. China may stay inward but it will surely will become the world’s largest consumption market going forward if Chinese government successfully manages its economic and political risks.

  • I have been actively into markets since 2015. It is 2021 and I have learnt a lot from my pursuit into the world of investments. I have come a long way and I wanted to share my learnings with everyone who is interested in learning about how the markets work. Also please note this duration of 6 years is marked by exceptional bull runs and exceptional conditions like a global pandemic which make this a very dynamic and incomplete experience for an investor like me. Take this with a pinch of salt as your experience maybe different than mine because the personality characteristics of a person play a central role in how you fare in the markets. I will go point wise to explain all my learnings and please feel free to share your views in the comments. Let’s begin.

    Your personality predicts your success

    Stock markets are definitely not for the faint hearted. If you like to see only profits and loose your cool when you face losses than markets aren’t for you. Stock markets are extremely rewarding for a person who seeks to understand the markets. You have to be patient, logical, humble and arrogant at the same time to understand the markets. Patience is important as you may analyse multiple stocks and choose specific stocks for investment and wait for them to increase in value. It can so happen that the stocks you choose may not move at all or go down as well. The problem may not be in your analysis but in the market’s perception of the company. This can cause a loss of opportunity in other stocks which are at the centre of attention of other investors. When I say logical that means not getting swayed by what the market is doing. Detach yourself from what the market is saying. Market maybe recording its best run but the fundamentals may not be there. At this point making reasonable assumptions is important because this will become a basis for your investment. If you seek to update your view just because your assumptions and market’s assumptions differ will open you upto a big gamble where you become reliant on what markets think and plan your investments on the basis of their assumptions. Now don’t get me wrong you can do this and still win but it will bring you in the realm of momentum trading and speculation. You should be humble enough to accept that you are a human and market is a human machine and that both can go wrong. Be humble enough to accept that your analysis will be wrong and keep searching for where you can go wrong. In terms of being an arrogant, don’t take this the wrong way because you will also not be wrong several times. Also staying open to difference in opinion is important as market is a place of opinions and forecasts, this will help you know where you have gone wrong and also validate your analysis.

    There’s no easy way to make money

    Note: the intention of this picture is to just express an idea. I have no connections with website stated above.

    There is no get rich quick scheme in this world. Stock markets are a place where there is a transfer of wealth from the impatient to the patient as per Benjamin Graham the father of value investing. Things like crypto and Tesla frenzy are driven by an excessive and extreme level of optimism. Looking at the valuations of Tesla itself tells you how logical the market is( getting the sarcasm?). I have nothing to say for crypto as I can’t find any fundamental basis on which the value of the crypto currencies can be based. There are no cash flows or real world usage. Lot of usage has been created because the crypto itself went up in value(cryptocurrency has existed since 2012 and nobody saw its usage until it made them a millionaire by luck) . It is just like internet bubble. These frenzies are like quick rich schemes. Don’t get me wrong here, the underlying technology of blockchain is amazing but the currency itself doesn’t hold any value at the moment. As soon as the tide turns it becomes ugly and lot of companies and individuals go bankrupt. If you can successfully value an asset then you know what you are doing but it requires research and dedication. Cryptos and Tesla require non of it as there is no fundamental basis left(Note: In Tesla’s case the valuation according to me is way above and represents a bubble so the fundamentals and stock price have become detached). The only technique one can find in valuing a crytocurrency is the market cap formula. I will cover more about it in future articles. Even when investing in stocks, you open up yourself to a lot of risk and not every company is the same. Relative valuation models may suggest similar pricing but it is not necessary two companies involved in same industry with same business model will be the same. There are too many minute differences in the companies which make them completely different. The more easier the opportunity to make money the more you should be asking what am I missing in my analysis especially in financial markets.

    Market is a human machine

    Credits: Google

    Often in our finance courses or economics courses we come across the fact that the market is objective. For the most part it is but at the same time it makes big mistakes. Most of the stocks maybe fairly valued but at the same time there will be a sizeable amount of stocks like Tesla just riding hope rallies. Think dotcom bust. It is the human activity that decides the pricing and volume of the financial assets and not some scientific theory. Correlations are formed from opinions and perceptions of financial assets. They are not objective and are more of subjective than the economic theories might suggest. Stocks get rigged, insider trading takes place and accounting frauds are made and those invested in such assets suffer. That time all objectivity goes out the window. Always look at market as an opinion of people expressed in prices. Whatever the asset class, whether a bond, mortgage backed security or gold, everything is dependent on opinions of people.

    Diversification vs Concentration

    Credits: Google

    If you are a Buffett disciple, you most likely know what I am about to say. If you follow the modern theories of portfolio management you are most likely to believe in diversification. I support both the theories but if you are an advanced investor who is into markets or wants to be in markets, diversification doesn’t make sense. Warren Buffett manages a stock portfolio in hundreds of billions of dollars and still goes on building sizeable positions which can constitute upto 40%(note: he doesn’t have any defined number, the number may keep changing) of his portfolio. At some intervals of time, he has held only three stocks or sometimes more than 10. It is on the basis of opportunity. Most importantly, not every company is as good as a top company. Not every management is top end. Not every industry is worth investing(by that I mean for long term). Even stock markets have their pyramids. It is just like your school or university, not every student is a topper. So diversification may also inevitably lead to picking up poor assets despite you knowing about it, just because theory of modern portfolio requires you to diversify. It would be absurd for us to ask Jeff Bezos or Elon Musk or Mukesh Ambani to sell their holdings in their companies for the sake of diversification. Also you have to keep in mind they are entrepreneurs more than financial investors. Same way, I believe one should concentrate their holdings in top companies that you like and know about. This would also not mean betting your entire savings on one single stock. Choose high quality stocks. Not necessarily large cap or mid cap or small cap. You have to be insanely sure about your analysis. Now for those who can’t do all the research and work, diversification makes sense and choosing superior fund managers will definitely help.

    Smart money vs Dumb Money

    Either you can be smart and do all the research or play dumb where you buy on tips based on where the wind is blowing in the market. Like I said, market is made up of humans and maximum assets you touch will not be gold so that opens you upto a risk where you will make good money but at the same time sometimes the probability of high risk will come true and you will loose it all. This happens very often and you won’t see it coming and this is the reason you need to keep asking yourself where you can wrong. Your job is to protect your money and see it grow and make sure you don’t loose it all.

    -Shivang Agrawal at WordPress

  • 2020 left global economies visibly shaken. The West was hit hard, US is still fighting the collapse and chaos caused from the Covid-19 pandemic. UK is still facing series of lockdowns. To rescue their economies, US and Europe undertook big fiscal and monetary measures. Just to give you an idea about the scale of the stimulus in US, 20% of US currency that exists today came into being only last year(as per October 2020). As per latest reports, this number stands at 40%. No wonder the dollar is under pressure. On the fiscal side, US national debt increased from close to 23 trillion dollars to 28 trillion dollars in one year due to Covid-19 response.

    Note: US public debt from January 2020 to January 2021 Credits: Statista

    To give you a comparison, see the graph of US public debt increase before pandemic struck.

    Note: US public debt from 1990 to 2020 Credits: Statista

    The spike in 2020 shows the plight of US policymakers to save the economy. Anyway, now as vaccination progresses, we seem to be entering into a multi year bull run especially for emerging markets. China reported positive growth for the year despite being the first country to get hit by the virus. Chinese economy grew by 2.3% as the year came to an end. India is projected to grow by 11% in FY22. I am more concerned about Indian context as I am an investor in Indian markets so I am gonna cover more on Indian markets in this article.

    Is it a bubble or a sustained rise in stock markets?

    I think the recent mouth watering rise in the stock market is justified especially from the Indian context. As the pandemic hit India, lot of companies begin a multi year deleveraging program to reduce stress on their balance sheets. Not only that, companies also undertook cost cutting measures at a big scale which is evident now as many companies have reported double digit growth in profitability. Thirdly, as the pandemic begin receding and economy opened up, the demand for all types of products barring hospitality and travel sector, reported strong growth numbers. Auto sector which has been badly hit since October of 2018 has started posting good numbers and the demand seems to be sustaining as of now. Other sectors like IT, banking, cement and steel also reported good numbers which have increased the investor sentiment. Meanwhile FMCG sector reported higher growth in 2020 compared to 2019 despite the fact that March and April saw country under lockdown. RBI on its side has done a great job to keep yields low although they may come under pressure as GoI undertakes fiscal consolidation over a longer glide path. It makes sense as GoI has gone for a pro growth budget to revive the economy. Looking from the valuation perspective, Indian markets seem to be richly valued but calling it a bubble is a mistake when the factors in the economy are overwhelmingly positive. The reason is that these valuations will sustain and are representative of Indian economy a year from now.

    Its time for capex

    2020 saw world changing their perception of Chinese economy and leadership. This was evident from the plans of Apple, the world’s most valuable company. Apple has already begin the process of diversifying its production of products. Central to this strategy was moving some production from China to India and Vietnam. In support of this strategy, lot of suppliers have now started emerging in India which otherwise would have not set up shop in India. In fact, Indian conglomerate Tata is investing 5,000 crore rupees to supply Apple with iPhone components. The launch of PLI scheme in other sectors as well and a low tax rate for manufacturing units is a positive for capex cycle. Even Indian companies have started announcing new investments to increase their production. Note worthy of these include UltraTech cement’s capacity expansion. Government of India has also focused on capex spending in this budget and has increased their spending by 34% for capital expenditure which will help India get back on pre Covid trajectory of growth. Meanwhile, on the other side, GoI has increased infrastructure efforts which will help bring down the cost of logistics in future. India has the highest logistics cost as a percentage of GDP at 13-14% of GDP when compared to advanced economies which are at 8-10% of GDP. Currently, Indian logistics is uncompetitive and with upcoming investments like Dedicated Freight Corridor the cost of logistics is going to fall.

    Other factors

    The overall economic environment is favourable. With interest rates at record low levels, fiscal stimulus and general adjustment of life to the new normal seems to be working fine. What is rather difficult to see through is how the future is gonna unfold. With US and Europe struggling to grow and at the same time increasing debt and money supply, inflationary pressures and also a risk of rising interest rates in future could dampen the growth prospects of West. Asia meanwhile continues to roar ahead as it is considerably less affected by the pandemic compared to West. India is entering a multi year bull run where schemes like PLI, infrastructure spending, reduction in cost of doing business and also improvement in laws could provide a good boost from structural perspective. Other positives like the formation of a bad bank for PSBs and government reducing its business exposure by either shutting down or selling off PSUs could open up vast amount of resources which could be spent on education, healthcare and building infrastructure. All in all, I think with such improvements India is opening up itself to higher growth as government focuses more on its own core functions. India’s entrepreneurial spirit also seems to be strong with multiple new era businesses like Ola, Flipkart, Zomato and numerous other setting a great example of India’s ecosystem being able to deliver high quality startups. It would seem like a mistake to stay out of the market. However, investing should always be done with some sense in the valuation.

    Shivang Agrawal on WordPress

  • Stock market charts are seen during the opening bell at the New York Stock Exchange (NYSE) on February 28, 2020 at Wall Street in New York City. – Losses on Wall Street deepened following a bruising open, as global markets were poised to conclude their worst week since 2008 with another rout. (Photo by Johannes EISELE / AFP) (Photo by JOHANNES EISELE/AFP via Getty Images)

    Stock market has zoomed up since the coronavirus pandemic started hitting India. The volatility of wild changes in stock indices in early March is now over. The only thing which is out of context is the entire stock market. Economy was in shatters in April-June quarter after lockdown. It seems to have recovered more in July but that still doesn’t justify the way market is moving upwards. Well, there are multiple reasons why its heading upwards.

    1. The huge round of quantitative easing happening world over

    This is most obvious reason for the rising stock market. Globally, many developed and developing countries have pumped in a lot of money into the system. This money is finding its way to the stock market. To put things into perspective, US Fed’s balance sheet size increased to 6.92 trillion dollars (as at 6th July) from 4.31 trillion dollars (as at 11th March) at the start of the crisis. Meanwhile, the European Central Bank increased its pandemic bond buying program to 1.35 trillion euros and intends on extending the same as the situation deems it to be fit. This sort of cash printing will not end right now. If 2008 crisis is any indication, the bond buying and cash printing will continue at least for a few years before central banks start reducing the size of their balance sheets.

    2. High inflation

    India’s retail inflation is above the nominal risk free rate. The retail inflation in June was at 6.09%. Nominal risk free rate is the coupon rate on Government securities. It includes a risk free rate of return and an inflation component in it. India’s ten year bond yield is at 5.814%(as on 23rd July) which suggests a negative risk free rate. This negative risk free rate is not sustainable and hence either inflation has to come down or RBI has to increase the interest rates to make sense of this situation because the risk in the markets has definitely increased while the risk-free rates have decreased. This negative return on a gross level in government securities means people are bound to go for equities to compensate for inflation and taxation. Businesses become more valuable with increasing inflation. They have the ability to compensate for rising inflation while bonds don’t.

    3. A much stronger India post coronavirus crisis

    India’s GDP growth will be in negative range this year with projections upto a decline of 6%. However, after the coronavirus crisis once the vaccine starts coming in and economies fully reopen, India will emerge as a very strong contender. India is already is witnessing a slow recovery in the economy with India manufacturing PMI rising to 47.2 in June 2020 from a low of 27.4 in April. Any reading above 50 means expansion. The India services PMI showed an increase to 33.7 in June 2020 vs 12.6 in May which is a pretty good improvement. Other greenshoots that are visible include reopening of factories and restart of supply chains all over India. It seems the worse of the economy is behind us. The great decoupling of Chinese and American economies is another advantage to India. Japan was recently seen offering incentives to move back production to home country. This sort of self dependence and high geopolitical risk sentiment will self fulfil the prophecy of local manufacturing. Diversification in supply line will become the new normal. With such low interest rates in the Indian economy, investments will start coming in as demand revives. Foreign investors are more likely to come to India in the future as the market is huge while its competitors offer a high growth rate like Vietnam, they do not offer a big market. When you compare the population like Vietnam’s and India’s, it is easily visible which country offers a bigger opportunity in terms of domestic market. No country comes close to India now in terms of the development cycles that can take place.

    4. The selective increase in indices

    Let’s look at the broader Indian market. Sensex and Nifty are on their way to achieve pre Covid highs. When you look at the mix carefully, India’s top firms have majorly seen increases in share prices. Many mid-caps and small-caps are still trading below their book values. Nifty is on the way to achieving its pre pandemic high of 12,000. It has recovered smartly from 7,500 points to 11,000 points in three months. In particular, the fire sale of stake in Reliance Jio has seen the shares of Reliance Industries achieving a new high of 1900 from a low of 800 in this same time frame. Even other shares that make up the Nifty like HDFC twins, have recovered to pre Covid levels. HDFC Bank went from a low of 765 to its pre Covid high of 1,100-1,200. The other stocks which make up the index include top IT sector companies, steel majors, other finance institutions, auto companies, pharmaceuticals, oil & gas industry and telecom which have all shown a recovery in share prices. Few industries in the index were facing headwinds even before pandemic and now after hitting the bottom they are witnessing a recovery which is aiding this rally. Sectors like steel, telecom and auto. IT sector has performed strongly, namely Infosys. This is certainly driving the market and investor perception. Overall, 16 stocks have recovered entirely from which 13 have hit a new lifetime high or pre pandemic highs. The remaining stocks which are down have mostly recovered or are at recovery path plus the weight they have on index is not enough to move the index in their favour.The recovery in the market is not broad based as one might come to think. BSE small cap index is still down about 2,000 points from the high it achieved in January and February period of 2020 to 13,000 points in July of 2020.

    5. Risk-Value equation

    The most important one is the fact that equities became insanely cheap. They went to lows which gave value a higher weight in value-risk matrix. Risk became small compared to gains which could take place once pandemic is over. This put the equation in favour of all the long term investors. Investors use the discounted cash flow models and ultra low interest rates mean an investor is going to make a lot more cash in each investment. The discounting factor’s influence has become much smaller in the analysis.

    Conclusion

    The rally in the markets is unlikely to be over soon. Even if earnings disappoint in the coming quarters, it is most likely that investors will ignore and concentrate more on the next year earnings. Anyways, stock market is already known to be ahead by a few quarters as compared to the economy. This rally is unlikely to stop as the interest rate environment is supportive of the markets and with monetary easing, betting money against the market will be very risky and depend on a very worse outcome of this pandemic.

    -Shivang Agrawal on WordPress

  • This week has been absolutely brutal, merciless and cruel for investors globally. Each and every asset has shown very extreme moves which were unprecedented. Markets have been unstable and caused huge losses. Almost all markets have declined more than 20% now. Oil fell by more than 30% after Saudi Arabia vowed to open its taps. Bond yields declined globally as money rushed to safe haven assets. US Treasuries fell below 1% for the first time. All of this has caused huge discomfort. The only question coming to my mind is how is the market going look ahead? Are we headed for a recession? Or a V shaped recovery? Well, I put some of my thoughts into how I view the situation after the absolute mayhem.

    1. Establish facts

    Based on economic data and few other anecdotes, it seems this effect could last only for 2-3 quarters based on containment efforts to fight coronavirus and monetary policy measures. There has already been a recovery in China with the virus already peaking there. The Shanghai Composite declined only 1.5% when other markets hit circuit breakers and experienced more than 5% declines. China’s exports fell by 17.2% in dollar terms in the first two months. Chinese factories have already started operating but at a lower capacity of 35-40%. Wuhan has also shown recovery with Chinese President Xi Jinping visiting the Hubei province. I don’t expect much destruction in financial markets if governments, monetary authorities and healthcare authorities are able to fight the outbreak. With China showing recovery, I am confident this Black Swan event will be behind us. Monetary authorities need to extend loans to companies struggling to up keep their businesses. What’s more concerning is that many Indian companies still continue to trade at a high valuation which again goes against wisdom of valuation but investors being confident of the companies to grow at a very rapid pace. If containment efforts fail, I am afraid of many more stocks to fall with index suffering more losses. Germany has warned about the possibility of 2/3rd of its population getting infected. Germany is Europe’s largest economy. It could give a big blow to other markets as well. Meanwhile, US is facing a big crisis with New York declaring state of emergency. A blow to the US will mean financial disaster as many companies have taken too much debt and returned cash to investors. This is an evolving situation to be fair. It will be better to base decisions on economy and containment efforts.

    2. Watch out for highly leveraged companies

    Many highly indebted companies could face a severe cash crunch if containment efforts fail. Long term problems of companies may magnify and finally give a death blow to these. Check for any linkages they have to other parts of the market which could hit those companies as well. Indian economy is recovering and I expect recovery to continue slowly as the government contains the virus. India will benefit going forward as companies have already started diversifying supply chains after severe issues related to components scarcity due to over reliance on China. US-China war had already changed their investment plans. With coronavirus, they will be more inclined to move out of China and diversify. An environment of low interest rates, negative yielding debt and a booming stock market resulted into companies leveraging and investors speculating in the market which suggests many companies may continue to see their share prices decline substantially. Exercise extreme caution when investing for long term. Stick with known names, good managements(no compromise in any market condition) and do a very conservative valuation as growth rates of many companies are gonna take a good hit in upcoming quarters. Many economies still carry the risk of coronavirus which could hit demand or supply sides or both. Do a careful analysis of margin and revenue mix before buying these companies and watch out for any management commentary. JLR has already seen its sales crash 85% in China. Many companies will start gaining market share in coming quarters due to their competitive advantages. Keep a tab on market shares as good companies gain market share during turbulent times in their respective industries.

    3. Stick to quality and hope for the best

    Stock market is a place where surprises keep popping up. It’s more psychological than economical in short term. Only thing which protects you from these surprises is quality. Quality in businesses always wins. Warren Buffett always prefers quality and this has rewarded him spectacularly. Sticking to quality right now will provide great returns in the long term. I expect a V shaped recovery if the virus is contained in major economies. I see this as a great opportunity to accumulate businesses for long term. I always prefer equity as they protect you against inflation and also deliver compounding returns. Valuation will ultimately save the day. Even quality stocks are hit but valuation protects losses. I have nothing more to add to this. I don’t believe this will last for long and even if it does, it is a great opportunity. Interest rates are gonna stay low for a while and share prices will command a premium in future. Financial models are not going to protect you today. Today, it is more of an emotional challenge than mathematical. Stay safe!

    -Shivang Agrawal on WordPress

    Source for images: Google

  • I have made a research report which can help you understand the business and finances of SBI Cards and Payments Services. If you have anymore questions, you can always contact me. I have included the PDF where you can read the research report that I have made. Thank you.

  • World has witnessed very low interest rates in last twenty years. Only developed markets have witnessed negative interest rates. Developing world continues to operate within the realm of normal economic models. Negative interest rates is surprising and unheard of. Today more than $17 trillion dollar of debt is trading negatively. Could it be a reason for worry? Or could it be an indication of countries fulfilling their economic objectives like providing fundamental things to its population like housing, clothing, access to education, etc. It is very hard to say but one thing is clear, as populations increasingly fulfil the basic and luxurious needs, the need to increase consumption will decline and cause interest rates to fall. Countries witnessing such fall in rate of increase in consumption may not be able to use monetary policy as a tool to address their growth rates. Increasing cash surplus with investors or lowering the interest rates might fail because practically there will be no need to spend that money anywhere unnecessarily in the economy.

    Is it a bond rally due to increased risk or a new economic scenario

    Well, for now it seems to be that consumers and investors, both the groups are being extra cautious than what we have witnessed in past 10 years since the financial crisis. The fund flows to bonds have increased tremendously in past 2 years. This article from Financial Times expressed the concerns over bond flows which pushed interest rates to negative as investors prefer more of debt due to safety offered by the fixed income assets. ‘About $487bn flowed into fixed income funds this year, up from $148bn in the first half of 2018, according to figures from Morningstar, the data provider. It is the highest level of first-half net inflows into bond mutual funds for at least a decade.’-Financial Express(I have provided the link here in case you want to take a better look at the article I borrowed the data from- https://www.ft.com/content/16c1fdaa-b094-3fe6-af7a-eb9883440974 another article which the investors can look at is from Investopedia- https://www.investopedia.com/gap-between-equity-outflows-and-bonds-cash-is-highest-since-2008-4774345). Economic scenario may also be partly blamed. Developed countries may have exhausted their economic resources to grow. Real factors like populations, market size, market development and other factors reveal the room for growth possibility and looking at developed countries suggests they may well be past their great cycle of economic growth. In economic theory as well, the growth comes from technology and labour force. Labour force in these countries are facing problems expanding from lower fertility rate, to lower immigration and protectionist policies. Technology continues to grow but to make a big economic transformation, you need a technology which affects big structural areas of the countries which doesn’t seem to be happening. Electric cars are coming but that may just shift the economic pie a little. Only other trend is artificial intelligence which has a long way to go.

    Political risk is high

    In the US, Donald Trump is facing an impeachment test. Meanwhile, populism is becoming more mainstream due to climate change and income and wealth gap. Future presidential candidates also present a big risk to US companies. Many have talked about breaking up the tech giants. Universal basic income scheme is also becoming more and more prominent. An unfavourable opinion about Republicans could dampen the prospects of seeing a Republican in the White House. The wave of populism could lead to US companies facing headwinds in their operations. Globally, countries have started trade war with each other to get their fair share. The integrated supply chains face an increased risk of getting higher tariffs on their imports and exports. In case the US-China trade war escalates it could lead to an increased chance of facing a downturn. It is a time ticking endeavour, Trump doesn’t have much time as the economy is suspected to be entering into recession as early as 2020.

    This downturn could be bad. The longer the expansion, the greater the risks.

    The upcoming recession could hit the US badly. With US-China trade war, Trump’s corporate tax cuts and the overvaluation of the US markets could lead to a hard fall. Under Trump, the government has increasingly used more and more debt to fund the growth of the GDP and this leaves really less fiscal room to for the government to counter the downturn. The current US government debt is at the highest since the World War 2. The Gross Public Debt to GDP stands at 106%. This doesn’t provide much room for the US government and makes it even more harder for the US to recover quickly from a downturn. The Federal Reserve may face issues due to lower interest rates which may not leave much room for it to counter the economic slowdown. One silver lining is the consumption driven nature of the US economy which could help counter slowdown in case the Fed chooses to use negative rates. One more plus point about this consumption, is that the American households have reduced their dependence on debt. ‘The ratio of debt to disposable income shows the same improvement in household finances since the Great Recession — down to 84.6% of annual income compared with 116.3% in the dark days of 2008 and 2009’ -Marketwatch. Another point of worry is the US corporate debt. (This article from Forbes gives a good idea-https://www.forbes.com/sites/mayrarodriguezvalladares/2019/07/25/u-s-corporate-debt-continues-to-rise-as-do-problem-leveraged-loans/#5bc9d0fa3596). Total US corporate debt is $15.5 trillion, 74% of US GDP. Of the $15.5 trillion of company debt, a little under 1/3 is in the form of leveraged loans and below investment grade bonds as per Forbes. Although companies are in a great shape, any downturn could trigger a chain of events which could lead to shrinkage of profit margins and hit the companies with high debt on balance sheet. The major concern lies in the BBB rated and below investment grade bonds. With the growth slowing, this could lead to bankruptcies in several companies. Debt levels are higher than they were before the 2008 financial crisis in the US corporates.

    Conclusion

    The risks from the coming recession are clear. The question still remains that, will the US and other developed markets really experience a recession? Many developed markets are facing recessions already from the likes of the UK to Hong Kong. Although they have local issues to blame, they could weaken the confidence of investors in other countries and lead to a self fulfilling prophecy. Managing risk at the moment carries outmost importance. That could potentially explain the investors’ run towards government debt for safety. Sticking to quality companies with strong balance sheets is a good way to stay invested in equities but again not being careful about paying a high price for the near term future is also not a good way to invest. Valuations should seem reasonable to warrant a purchase anytime. Buying bonds towards the lower end of interest rate cycle can depress the returns in the future and make capital appreciation that much harder. Holding cash also seems a great option when the markets seem to be harder to read. Sitting on cash is never bad if you are not comfortable with the risks in the market.