India’s startup ecosystem has seen its fair share of success and failures. It has seen success of e-commerce with Flipkart becoming the homegrown alternative to American giant Amazon while it has also seen spectacular failures in big unicorns like Byju’s. All in all, India continues to remain a bright spot in global startup investing. India has built notable names globally and one more industry where India could shine is the private market data industry with India’s answer being Tracxn. It is a platform which operates globally and is a homegrown entity involved in private market data for investors like private equity funds, venture capital funds, M&A units of large corporates, universities & many more different type of customers who may need such data. It is a direct play on the growth of the private financing industry.
P.S. – This article purely meant for educational purposes. Do not consider any conclusions from this blog as buy or sell decisions. Please do your own independent research for investment purposes. This blog is not responsible for any loss in investment by the reader. As a disclaimer, the writer of this blog doesn’t hold any investment in the given stock.
The business model
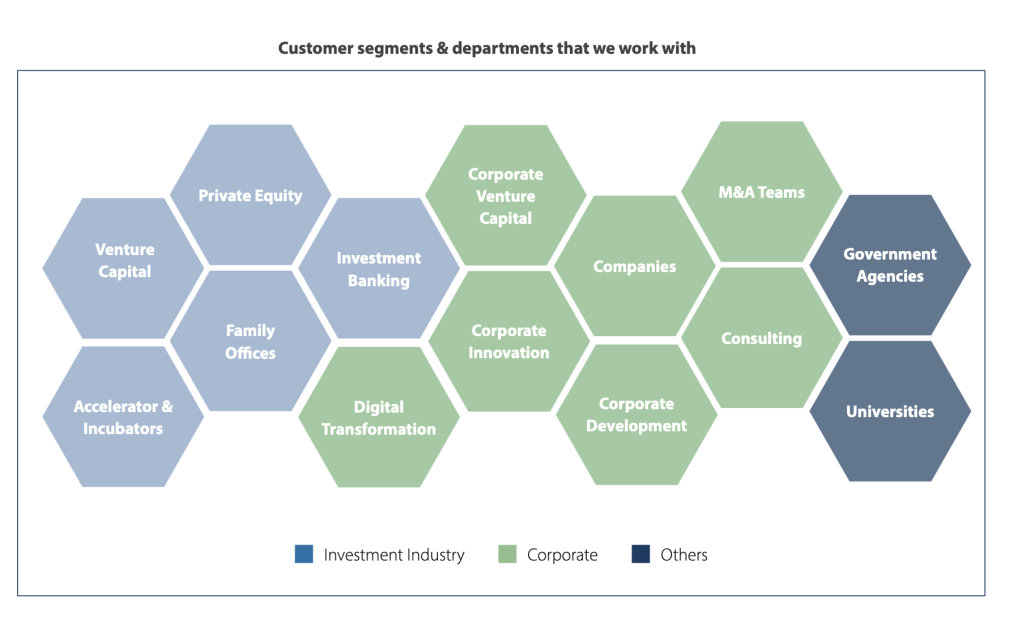
Tracxn is a comprehensive platform tailored for private market company data and intelligence. Think about PE investors, they require information on prospects, from financials to shareholding. Tracxn acts as a one stop portal which provides information of private companies to prospective investors. The information can range from shareholding, cap tables, competition, financials, valuations, transactions and more. It also provides information on fund performance of different private market focused funds like venture capital and private equity to prospective investors. This service becomes valuable as it helps save time and improves discovery side for funds. Lot of manual work gets automated for analysts and investors. Tracxn generates revenue by selling subscription of its platform to clients ranging from private market investors to corporates, universities and any prospective client who may need such information.
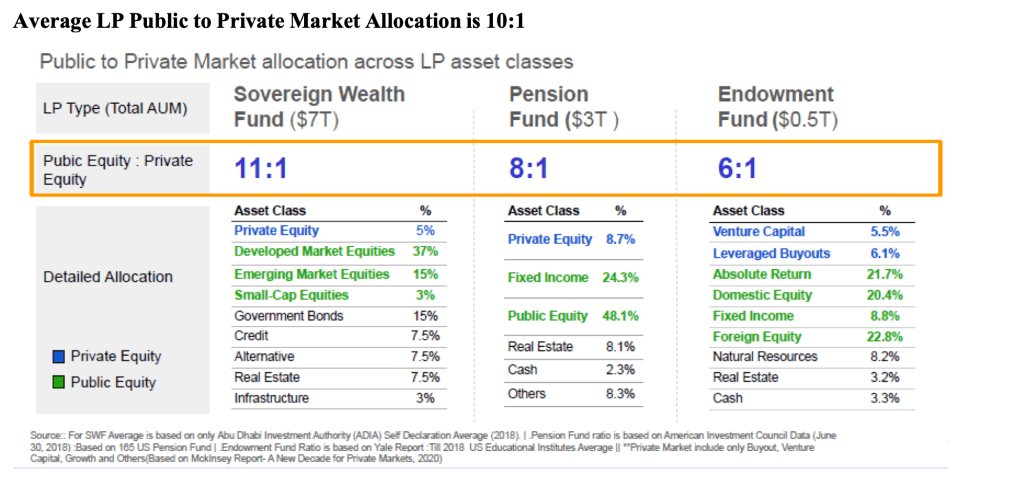
Just to explain the value chain of the industry. Investors in a private equity fund or venture capital fund is known as limited partner. They range from insurance companies, sovereign wealth funds, university endowments, ultra HNIs and more. The funds pool this capital from different partners and then find prospective companies in private market to buyout or invest in. The fund is generally managed by someone known as general partner and looks after the complete operations of the fund. Private equity funds usually deal with companies which are already mature and can be taken for an IPO or sold to another PE investor or any strategic buyer. PE funds try to extract value from investment by cutting costs in companies and loading them with debt on purchase, also called, leveraged buyout. The cash flows of the company are used to payoff the debt taken to finance the purchase. In venture capital world, the only thing which changes is that VCs focus on funding companies which are new or also known as startups. Their payoff depends on investing in several companies with most of them going bankrupt with few of the winners more than making up for losses and giving decent returns. VCs also provide strategic advice and consulting to startups to help them scale up. PE funds and VC funds are highly dependent on public market performance and other funds to exit their investments which means if the funds are holding low quality businesses or caught in wrong side of the cycle can face potential destruction of returns or bankruptcy as well. Tracxn enters in the value chain at both LP level and fund level by providing intelligence.
Side note:- Cap table is a document which contains and details ownership of company and becomes valuable for prospective investors to make investment decisions.
Market size scope
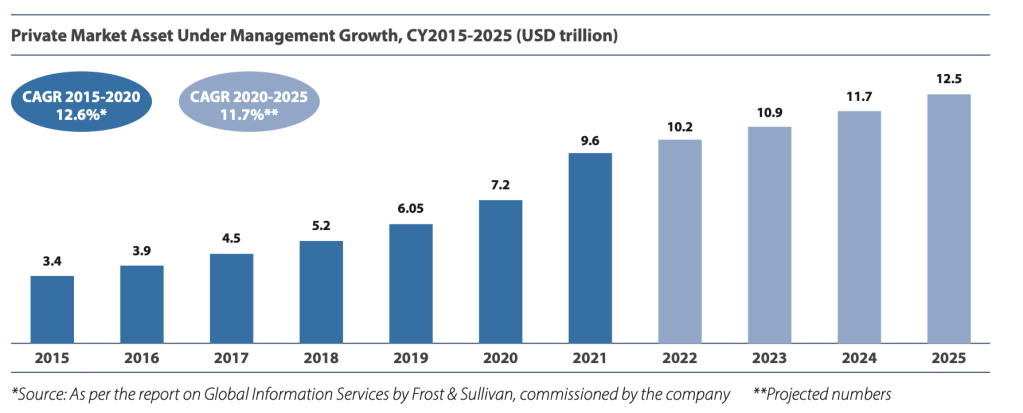
Private market asset management industry managed close to 9.6 trillion dollars during 2021 and recorded a growth of 12% on CAGR basis from 2015 to 2020. The industry is expected to hit a size of 12 trillion dollars under management by 2025, posting a growth of 11.7% on CAGR basis from 2021 as per report from Frost & Sullivan. The number of addressable market for private market data platforms stands at 100,000 organisations at a global level. These include investment banks, private equity funds, venture capital funds, corporate M&A departments of large corporates, universities, etc. Number of PE firms has grown from 7,800 in 2015 to 19,512 in 2021. Number of investment banks has also grown from 6,058 in 2015 to 11,923 in 2021. Number of VC funds has grown from 12,873 in 2021 to 27,506 in 2021. Total available market size stood at 2.58 billion dollars as of 2021. It refers to the market that has not yet been fully penetrated and still has opportunities available. Total addressable market stood at 1.19 billion dollars in 2021. It refers to the market that is being serviced by private market data players currently. Currently private market investors make up about 55% of the total addressable market while corporates make up about 31% and rest is accounted by others as of 2020. North America makes up 44% of the total addressable market, EMEA (28%), APAC (26%) and RoW (2%) as per 2020. According to Frost & Sullivan, market penetration is expected to improve from 52% in 2020 to as high as 65% by 2025.
Business – Description, Competition, Strategy & Prospects, Financials, Investor Mix, Risk-Reward equation
Description
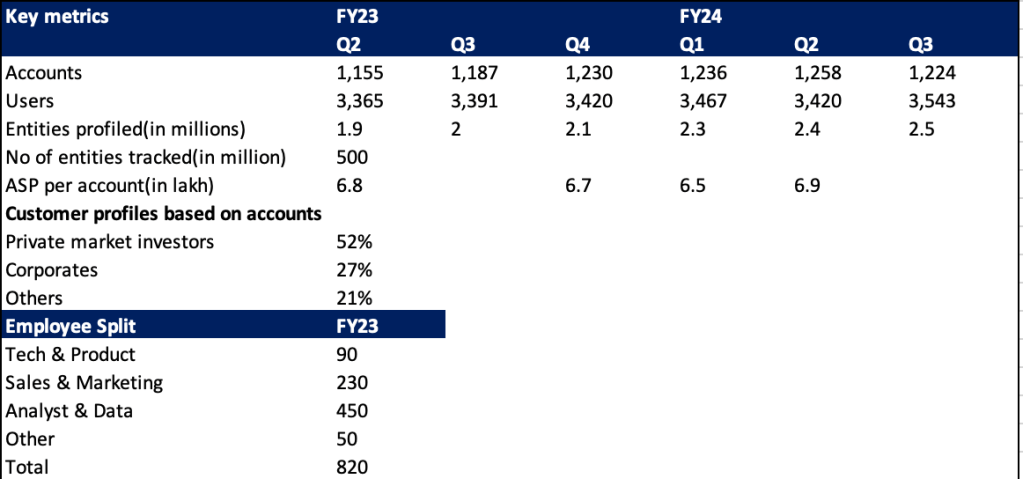
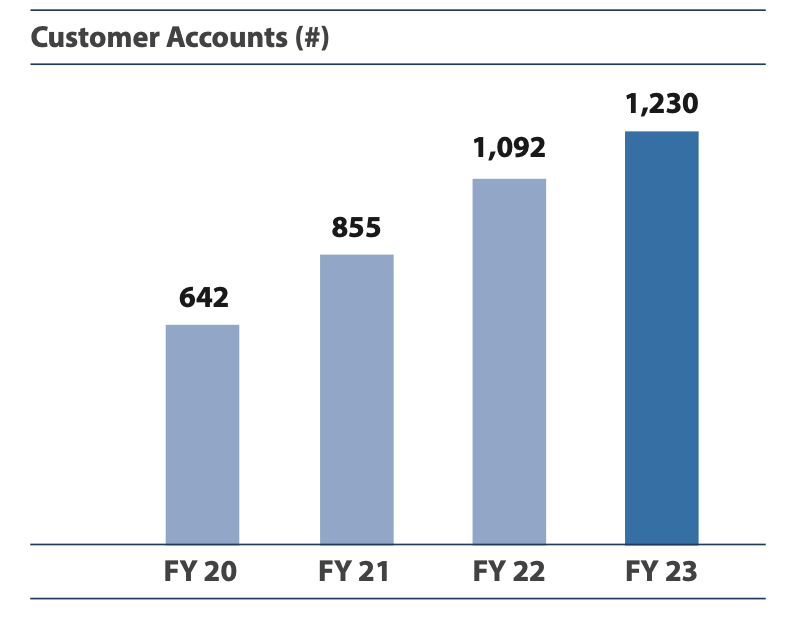
Tracxn was founded by Neha Singh and Abhishek Goyal in 2013. Both of the founders belong to venture capital world. Neha came from Sequoia Capital while Abhishek was with Accel Partners. Tracxn is entirely based in India while all its competitors are based overseas. Company generates revenue from subscriptions by selling quarterly and annual subscriptions to its platform. In FY23, annual subscriptions made up about 63% of the total subscriptions mix. Tracxn platform collects data from world over using government filings, digital footprints of companies and over 750 mn+ domains across emerging technology sectors. Company’s advantage resides in its tech stack and being based in India. Company’s operations are asset light but highly dependent on employee cost as it makes up about 89% of the cost structure hence the advantage of being based in India. Cloud hosting charges is the second largest expense in the cost structure and makes up about 3% of the cost structure. The key metrics to understand this business include number of accounts, number of users, entities profiled, daily active users and monthly active users which give you a sense of the economics of the business. Platform’s value will keep increasing as more data is added on the backend and network effects start kicking in as more players start to use the platform. On the backend, Tracxn tracks more than 500 million entities while the number of entities profiled on the platform has increased from 1.9 million in Q2FY23 to 2.5 million in Q3FY24. Number of customer accounts has grown from 1155 in Q2FY23 to 1224 in Q3FY24, although number of customer accounts saw a dip in numbers in previous quarters after recording growth. Each customer account gives access to multiple users. So one single entity takes one customer account and as the research team expands more users are added for a smaller fee relatively than the first account. Average realisation per user is at 2.4 lakhs per year. First user price stood at 5 lakhs per year. Average realisation per account stood at 6.9 lakhs per year as of Q2FY24. As an investor, you need to understand account growth will lead to faster revenue growth because initial cost of gaining access to service is higher and as you add users the cost per added user falls to an extent. Thus if company chooses to grow existing accounts, it will generate slower growth as compared to getting new customers in which will lead to higher generation of revenue growth. Another key metric to track includes employee strength as the business model requires interaction with customers to onboard them and continually service them. Also, the business requires backend team on both technology and data to maintain the platform and increase its value. I have provided the data on employee strength breakup and other metrics below.
Competition
Tracxn’s competitors mainly include overseas players like Pitchbook, Crunchbase and CB insights. Pitchbook was acquired by Morningstar. International players are few times bigger than Tracxn. The platforms have their own unique USP as per management which means the overlap between products is on a lesser extent. In total, there are 6-7 players competing in same space. Tracxn holds a single digit market share in the industry and almost all other players as well hold single digit market share in the industry. Tracxn might hold some pricing power due to its unique offering. Tracxn’s main focus has been on emerging technology sector. Company is also seeing decent customer retention at 75%.
Strategy & Prospects
Tracxn’s strategy has been to grow both users under existing accounts and acquire new customer accounts. Growing users within a customer account has limited scope and is dependent on fund size. Also, Tracxn’s coverage of international markets also will be influential in maintaining growth rates. Bulk of the customers are using the platform for the first time. International realisations are 1.5x of India. Tracxn’s management expects existing customers to grow at low double digits while main growth is expected to come from new customers. It will pay to watch out how Tracxn is able to grow its international revenue due to the sheer size of overseas markets and higher realisations. International revenue makes up 70% of revenue as of FY23. Company does not have any marketing cost as it relies on lead generation by distributing its own data organically through news articles and other sources. Management has showed willingness to explore inorganic expansion initiatives and is expecting costs to remain under control with increase in revenue. Company is also doing account tightening right now which is leading to reduction in customer accounts. Currently, IB fee is at 10 year low, global tech funding is at 5 year low and unicorn creation is at a 7 year low, suggesting the cycle maybe close to bottoming and growth should eventually pickup. Management is forecasting revenue to grow faster and eventually touch 30% growth mark and costs to grow under 10% mark for next 2 years, suggesting margins have ample scope for expansion.
Financials
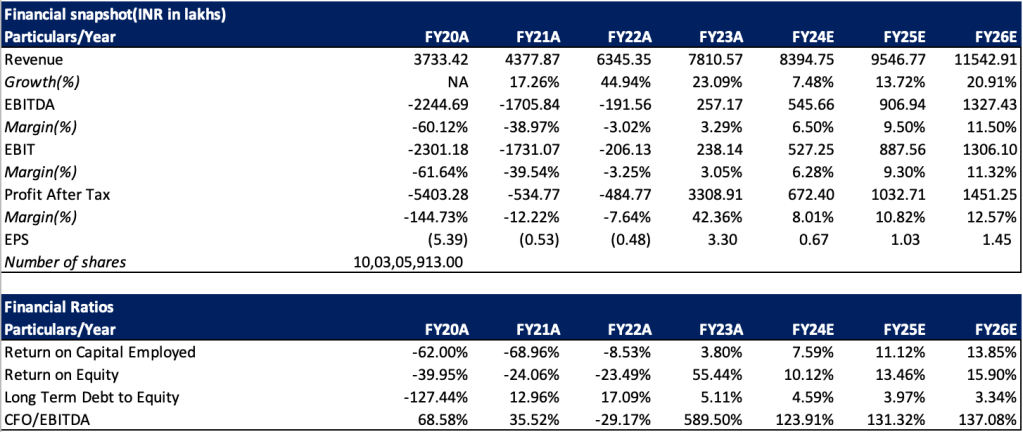
Company’s sales has grown from 37 crores in FY20 to around 78 crores in FY23. FY24 revenue estimated to be around 84 crores, growing about 7.6% year on year. Revenue is fairly diversified as is visible above with number of customer accounts. About 31% of turnover is generated in Americas, 32% in India, 27% in EMEA and 10% in APAC (ex India). Clearly, Tracxn’s penetration in India is way higher than Americas, despite Americas being the top biggest market for PE and VC funds, which indirectly suggests Tracxn’s market share is way higher in India as compared to Americas. India was the fastest growing market in FY23 for Tracxn at 32% while Americas stood at 30% and EMEA was a dismal rate of 8%, more or less reflection of startup momentum and economic problems in Europe and Middle East. APAC still put up a decent show at 18%. Management is forecasting a growth of 30% over next few years eventually which seems achievable, although growth has gone down significantly lately due to issues in private market after US Federal Reserve and global central banks increased interest rates significantly and caused a drop in valuations of startups. This suggests industry is cyclical and as company grows in size, future economic woes may have much larger impact. Bulk of the revenue is generated in USD means any deprecation or appreciation in Indian rupee against USD will impact the topline.
Tracxn as a business generates cash flow before providing service because it is selling a subscription to access the platform which makes it a negative working capital company. Any business which gets paid upfront before providing good or service is in a very good position. Even with this approach, Tracxn has seen some receivables build up in balance sheet to the tune of 10 crores in FY23. Nothing concerning as percentage in balance sheet has stayed constant more or less but this suggests Tracxn is offering some of its clients credit to use the platform. Debtor days has not seen much change in trend at around 40 days.
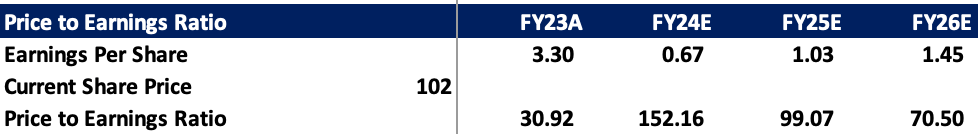
On the cost side and profitability side, EBITDA margin expanded from -60% in FY20 to 3.3% in FY23 and is further on the side of expansion as operating leverage benefits start kicking in with latest quarters recording margins around 8-9% at EBITDA level. I expect margins to continue to expand as business gains momentum but company’s major cost which is employee cost has seen some expansion not at same pace but enough to warrant some caution. Management currently compensates senior level management with ESOPs in place of bonuses which is causing expansion in share capital and is also visible in reduction in promoter stake by a very small percentage without any sale by promoters. Another key risk metric will be profitability. Tracxn had seen reversal of IPO expense in FY23 which has caused margins to become abnormal(around 42%). This will reverse back to around 7% for upcoming financial year. This places significant downside risk on valuation as there is no scope for error left with the company trading around 156 PE as of FY24 estimated earnings. EPS has fallen from 3.30 rupees per share in FY23 to around 0.67 in FY24 (Please note this is estimated EPS for FY24). Since the business is not capex heavy, almost all types of costs are visible on the P&L itself and means any profit generation that takes place becomes free cash flow and available for distribution and share buybacks.
Investor Mix
Both the promoters also hold similar stake in the company. Abhishek holds 17.60% while Neha holds 17.33%. Neha is the chairperson and MD while Abhishek is is the vice chairman and executive director. FIIs hold about 3.37% and DIIs hold close to 13.36% as of December 2023 quarter. This is down from 22% in December 2022 quarter. Tracxn was also backed by Ratan Tata, Bansals of Flipkart, Elevation Capital, Sequoia Capital, Accel and many more prominent investors during its early days.
Risk-Reward Equation
Risk reward equation might not favour investors at the moment due to the high valuation with no room for error. Company is reporting high single digit growth and current valuation is completely dependent on margin expansion and growth in turnover. The growth needs to hit the 30% mark as the management is suggesting to reduce the gap in valuation and fundamentals. Company is currently sitting at a forward PE of 99 for FY25’s estimated numbers, assuming growth picks up to double digit and company sees continued margin expansion. Any delay in growth pickup or slower expansion in margins will open up major downside scope for the valuation. What will work in investors’ favour is the economic environment which seems to have started recovering with speculative assets like bitcoin rising significantly and IPOs roaring back in India. EMEA region growth, faster than anticipated expansion in margins, changes in ESOP policies and any management specific actions like share buybacks, announcement of dividends and inorganic acquisitions might help maintain the current levels of the stock. Of course, do your own analysis and again this isn’t a buy or sell recommendation.
-Shivang Agrawal at WordPress

Leave a comment